Unified Logging
Capture telemetry from your app for debugging and performance analysis using the unified logging system.
Generating Log Messages
You specify both strings when creating the log object, using values that are relevant to your app:
- The subsystem string identifies a large functional area within your app or apps. Use reverse-DNS notation for each subsystem string.
- The category string identifies a particular component or module in a given subsystem. For example, user interface, data model, and networking.
You might use the default log to record messages that don’t require a specific subsystem and category.
The system stores all messages in memory initially, and it writes messages with more severe log levels to disk. 默认情况下,debug, info 存储在内存;default, error, fault 持久化到硬盘。
Objc 用法:
os_log_t log = os_log_create("com.yianzhou.DemoOSLog", "Objective-C");
os_log(log, "Hello world! %d", 100);
os_log_error(log, "Error %d", 404);
os_log_with_type(log, OS_LOG_TYPE_ERROR, "Error %d", 404);
Swift API:
@available(macOS 10.14, iOS 12.0, watchOS 5.0, tvOS 12.0, *)
public func os_log(_ type: OSLogType, dso: UnsafeRawPointer = #dsohandle, log: OSLog = .default, _ message: StaticString, _ args: CVarArg...)

@available(macOS 10.12, iOS 10.0, watchOS 3.0, tvOS 10.0, *)
public func os_log(_ message: StaticString, dso: UnsafeRawPointer? = #dsohandle, log: OSLog = .default, type: OSLogType = .default, _ args: CVarArg...)

@available(macOS 11.0, iOS 14.0, watchOS 7.0, tvOS 14.0, *)
public func os_log(_ message: OSLogMessage)

@available(macOS 11.0, iOS 14.0, watchOS 7.0, tvOS 14.0, *)
public func os_log(_ logLevel: OSLogType = .default, log logObject: OSLog = .default, _ message: OSLogMessage)

@available(macOS 11.0, iOS 14.0, watchOS 7.0, tvOS 14.0, *)
public struct Logger {
    public func log(level: OSLogType, _ message: OSLogMessage)
}
Swift 用法:
if #available(iOS 10.0, *) {
    let log = OSLog(subsystem: "com.yianzhou.DemoOSLog", category: "swift")
    os_log("Error! %d", log: log, type: .error, 404)
    if #available(iOS 12.0, *) {
        os_log(.default, log: log, "Hello world! %d", 100) // 参数顺序不一样,其它都一样
    }
    if #available(iOS 14.0, *) {
        let x = 100
        os_log(.default, log: log, "A string interpolation \(x)") // 可以使用 string interpolation
        let logger = Logger(subsystem: "com.yianzhou.DemoOSLog", category: "swift")
        logger.log(level: .error, "Error \(x)")
    }
}
Viewing Log Messages
The unified log system stores log messages in a binary compressed format, deferring much of the work to turn them into human-readable text messages.
You view log messages using the Console app, log command-line tool, or Xcode debug console.
You can also access log messages programmatically using the OSLog framework.
Log data is kept in a compressed binary format: .tracev3 files stored under /var/db/diagnostics/ with support in /var/db/uuidtext.
New .logarchive format for portability of logs. Essentially a .logarchive is a collection of information out of /var/db/diagnostics and /var/db/uuidtext collected together into a single file that's easier to transfer to email or to attach to bug reports.
Activity Tracing
Activities associates log messages with user actions or other app-defined events.
- (IBAction)treeButtonTapped:(UIButton *)sender {
    os_activity_t init_activity = os_activity_create("Init", OS_ACTIVITY_CURRENT, OS_ACTIVITY_FLAG_DEFAULT);
    os_activity_t verify_activity = os_activity_create("Verify", init_activity, OS_ACTIVITY_FLAG_DEFAULT); // 创建层级关系
    os_activity_scope(init_activity);
    os_log(OS_LOG_DEFAULT, "init something...");
    if (true) {
        os_activity_scope(verify_activity); // All of the rest of the code is considered in scope of `verify_activity` until hits the closing brace.
        os_log(OS_LOG_DEFAULT, "verifying something...");
    }
    // And as soon as you leave that scope, you're now no longer part of `verify_activity`.
}

Signpost Events
Signposts extend the OSLog API, but they do it for the performance use case. That means they are conveying performance related information. You can annotate your code with signposts and find them in Instruments.
Instruments - Template: Blank - Add Library: os_signpost.
if (@available(iOS 12.0, *)) {
    NSURL *url = [NSURL URLWithString:@"https://www.baidu.com/"];
    os_log_t server_log = os_log_create("com.yianzhou.DemoOSLog", "Network");
    // If two operations overlap but they have different signpost IDs, the system will know that they're two different intervals.
    //  os_signpost_id_t signpostID = os_signpost_id_generate(server_log);
    os_signpost_id_t signpostID = os_signpost_id_make_with_pointer(server_log, (__bridge const void * _Nullable)(url));
    os_signpost_interval_begin(server_log, signpostID, "server request");
    [[[NSURLSession sharedSession]dataTaskWithURL:url completionHandler:^(NSData * _Nullable data, NSURLResponse * _Nullable response, NSError * _Nullable error) {
        os_signpost_event_emit(server_log, signpostID, "data fetched");
        if (response != nil) {
            os_log_debug(server_log, "%@", [response description]);
        }
        os_signpost_interval_end(server_log, signpostID, "server request");
    }] resume];
}
Points of interest with Time Profiler:
os_log_t poi_log = os_log_create("com.yianzhou.DemoOSLog", OS_LOG_CATEGORY_POINTS_OF_INTEREST);
os_signpost_event_emit(poi_log, signpostID, "data fetched");
Architecture
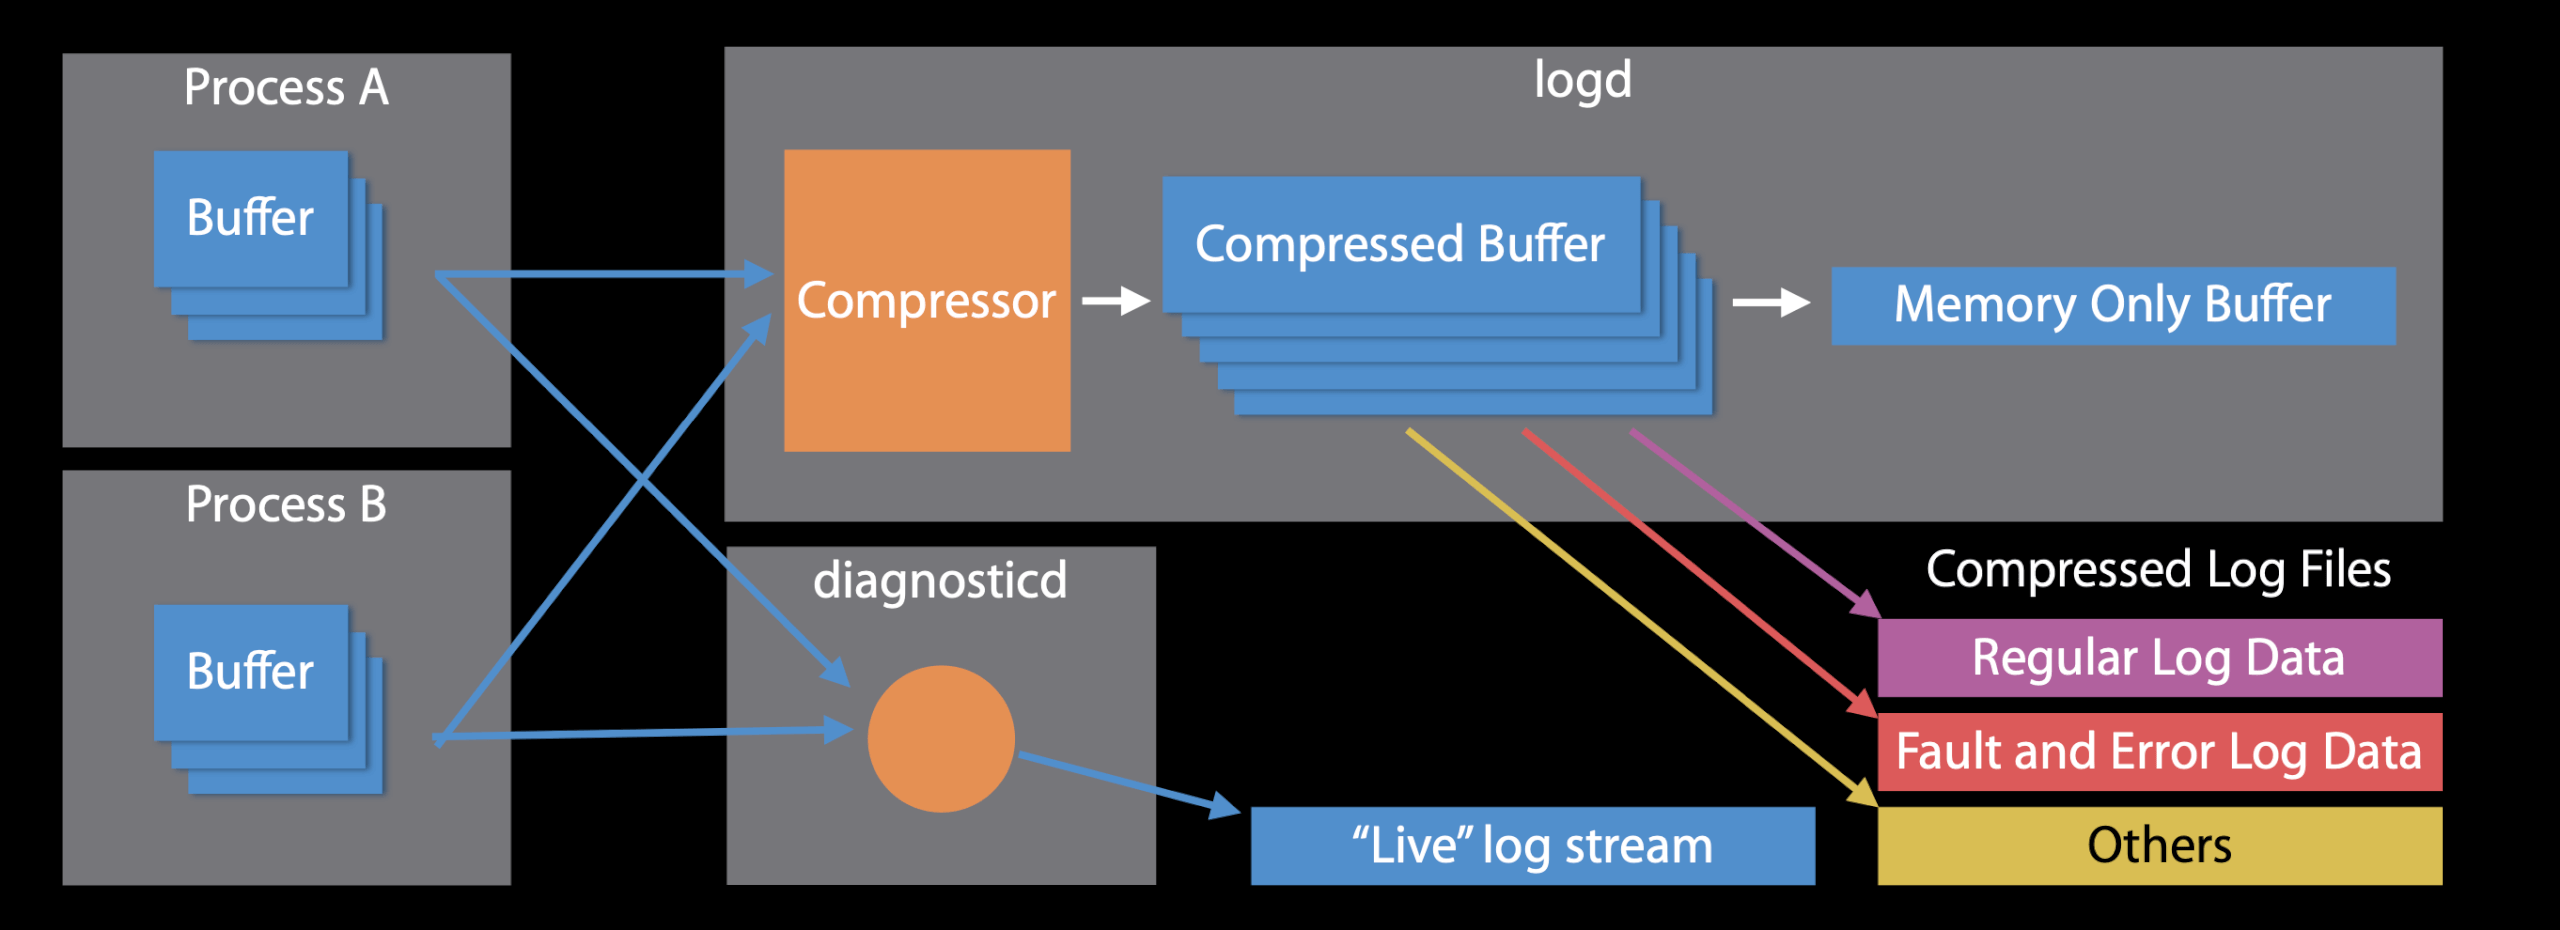
Within each process there's a collection of small buffers into which we log messages. These buffers are actually in memory that's shared with the logging daemon. As these buffers are filled up the logging daemon is triggered to compress that data into a set of larger buffers that it maintains. As those larger buffers are filled up we either save them out to disk or we recycle them as part of the memory only buffers.
If you request livestreaming of log data, we immediately do an IPC over to the diagnostic daemon who then distributes those log messages out to all the clients (e.g. Console.app).