性能优化
Measuring
Code Instrumentation: (Profiling in release builds but don't ship your instrumentation)
@IBAction func showImageTapped(sender: UIButton) {
#if MEASURE_PERFORMANCE
    let startTime = CFAbsoluteTimeGetCurrent()
#endif
    let myData = Data(contentOfFile: self.path)!
    let myImage = self.watermarkedImageFromData(myData)
    self.imageView.image = myImage
#if MEASURE_PERFORMANCE
    let endTime = CFAbsoluteTimeGetCurrent()
    let totalTime = (endTime - startTime) * 1000
    print("showImageTappedTimed took \(totalTime) milliseconds”)
#endif
}
性能优化的方法论:
All performance work should be based on measurement.
Before you start solving a performance problem, you should measure, to establish a baseline so you know where you stand.
As you iterate on solving a performance problem, you should measure it each step of the way to ensure that your performance changes are having the impact that you expect.
When you're done solving a performance problem, you should measure again, so that you can compare to your original baseline, and make a quantified claim about how much you've improved the performance of your application.
Time Profiler
WWDC 2015 - Profiling in Depth
I would encourage all of you, if you just learn one of Instruments, it should be the Time Profiler. I use it for 95% or more of my performance work.
You should do your time profiling on release builds to take advantage of the compiler optimizations. 其中一项编译器优化就是尾调用消除,后面会详细介绍。
使用技巧:
- 按住 option 键可展开至最深层调用栈
- 右侧 Heaviest Stack Trace
- 按 CPU 查看、按线程查看,可以检查我们的代码是否真正利用了多线程并发
- Self Weight: the amount of time that was spent within that method itself, and not some other method that it called
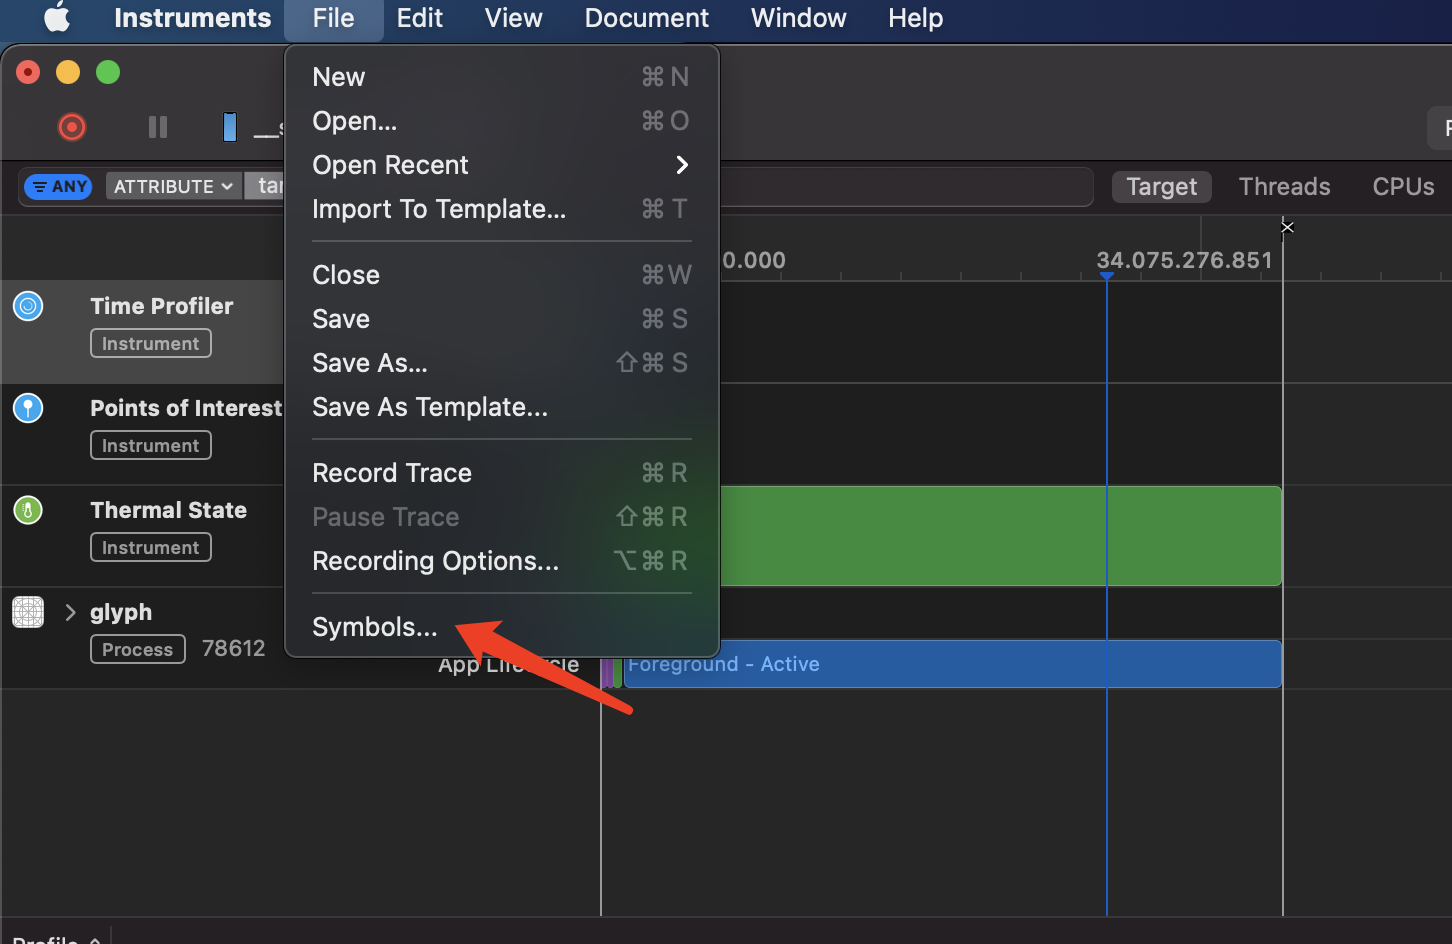
我跑 Time Profiler 怎么看不到函数符号呀?——定位一下 dSYM 文件路径
How it works
When the call is made to the drawRect: it will push a call frame onto the stack including return address from the link register and the previous value of the frame pointer. Now drawRect: knows how to return to its caller and restore the frame pointer.
Next, we take the frame pointer set up to the new base. Then drawRect: will make room for its local variables and the compiler scratch space 暂存空间. Now we have a frame for drawRect:.
Next the code starts to run and we come down to CGContextDrawPath and it does the same thing. It pushes a frame onto the stack.
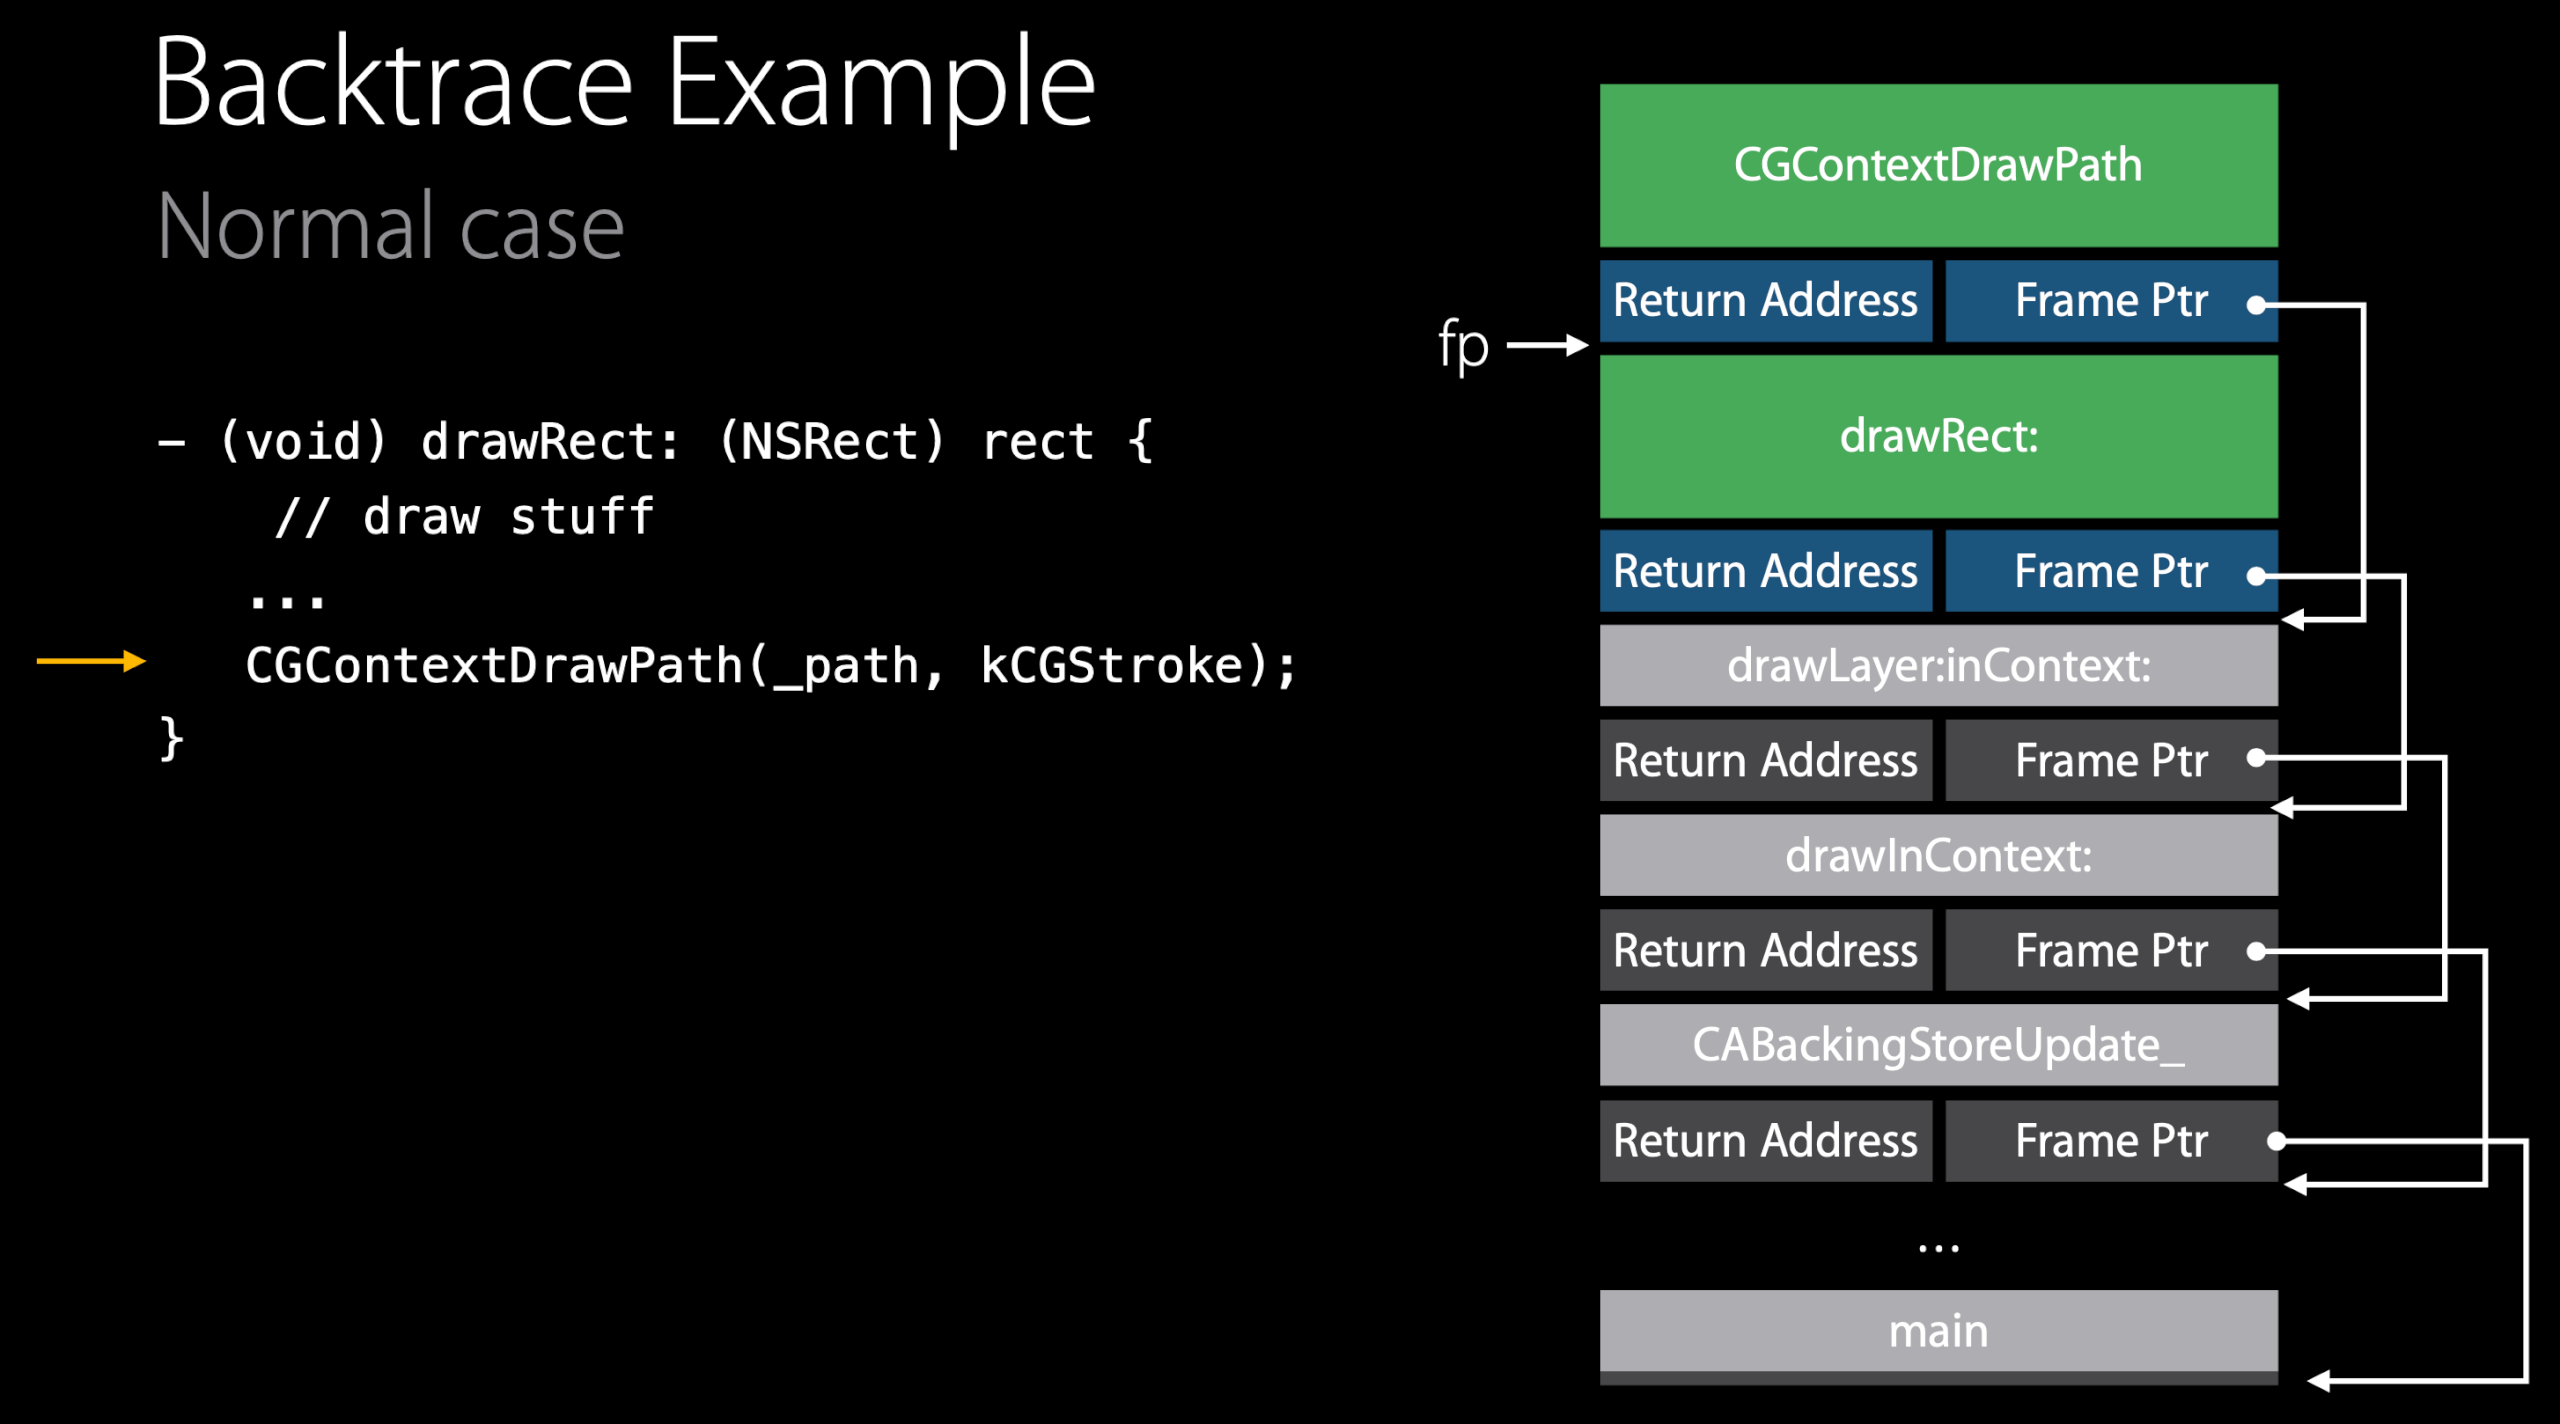
The way time profiler works, it uses a service in the kernel that will sample what the CPUs are doing at about 1000 times per second.
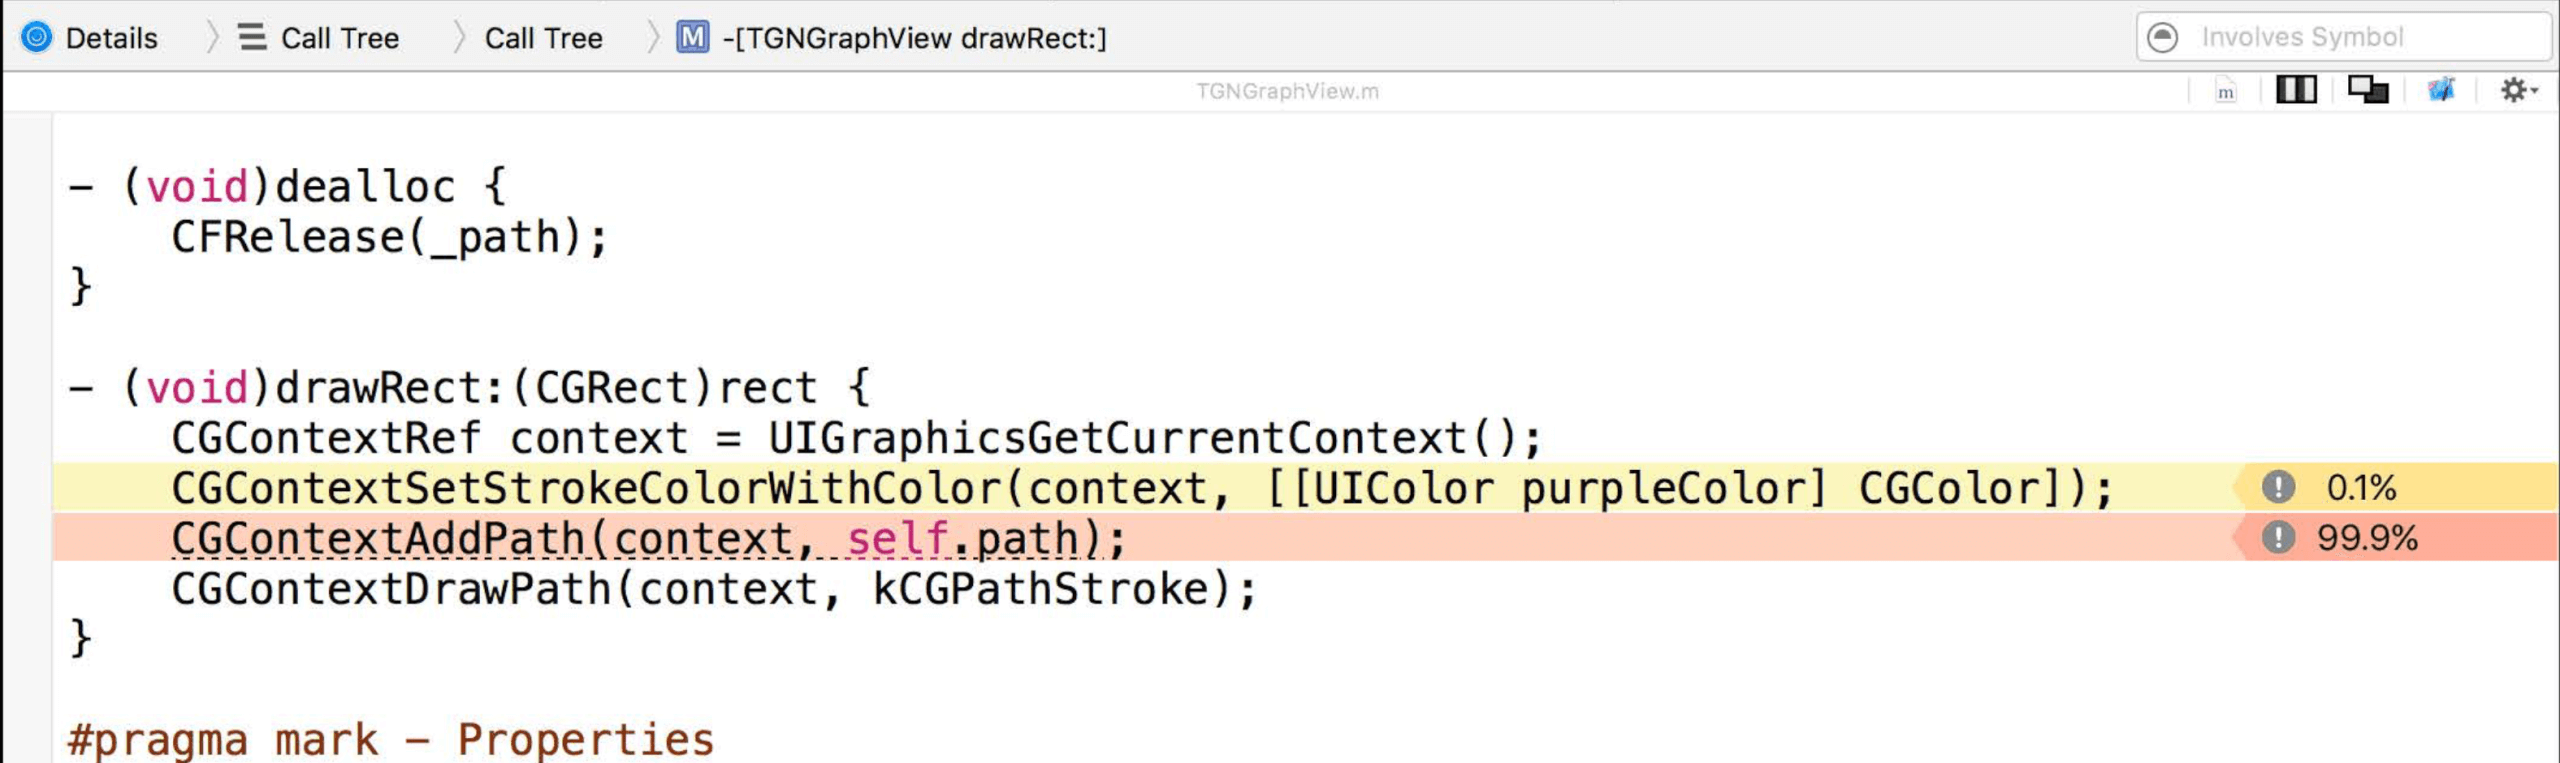
In this case, if we take a sample, we see that we're running inside of CGContextDrawPath.
Then the kernal looks at the frame pointer register to see where the base of that function's frame is and find the return address of who called it.
We can use the frame pointers that were pushed on the stack to find the base of drawRect: and then continuously go back through the stack until we hit the bottom. This is called backtrace.
If we take enough of these and put them in the call tree view you can get a pretty good picture of what's going on inside of your application.
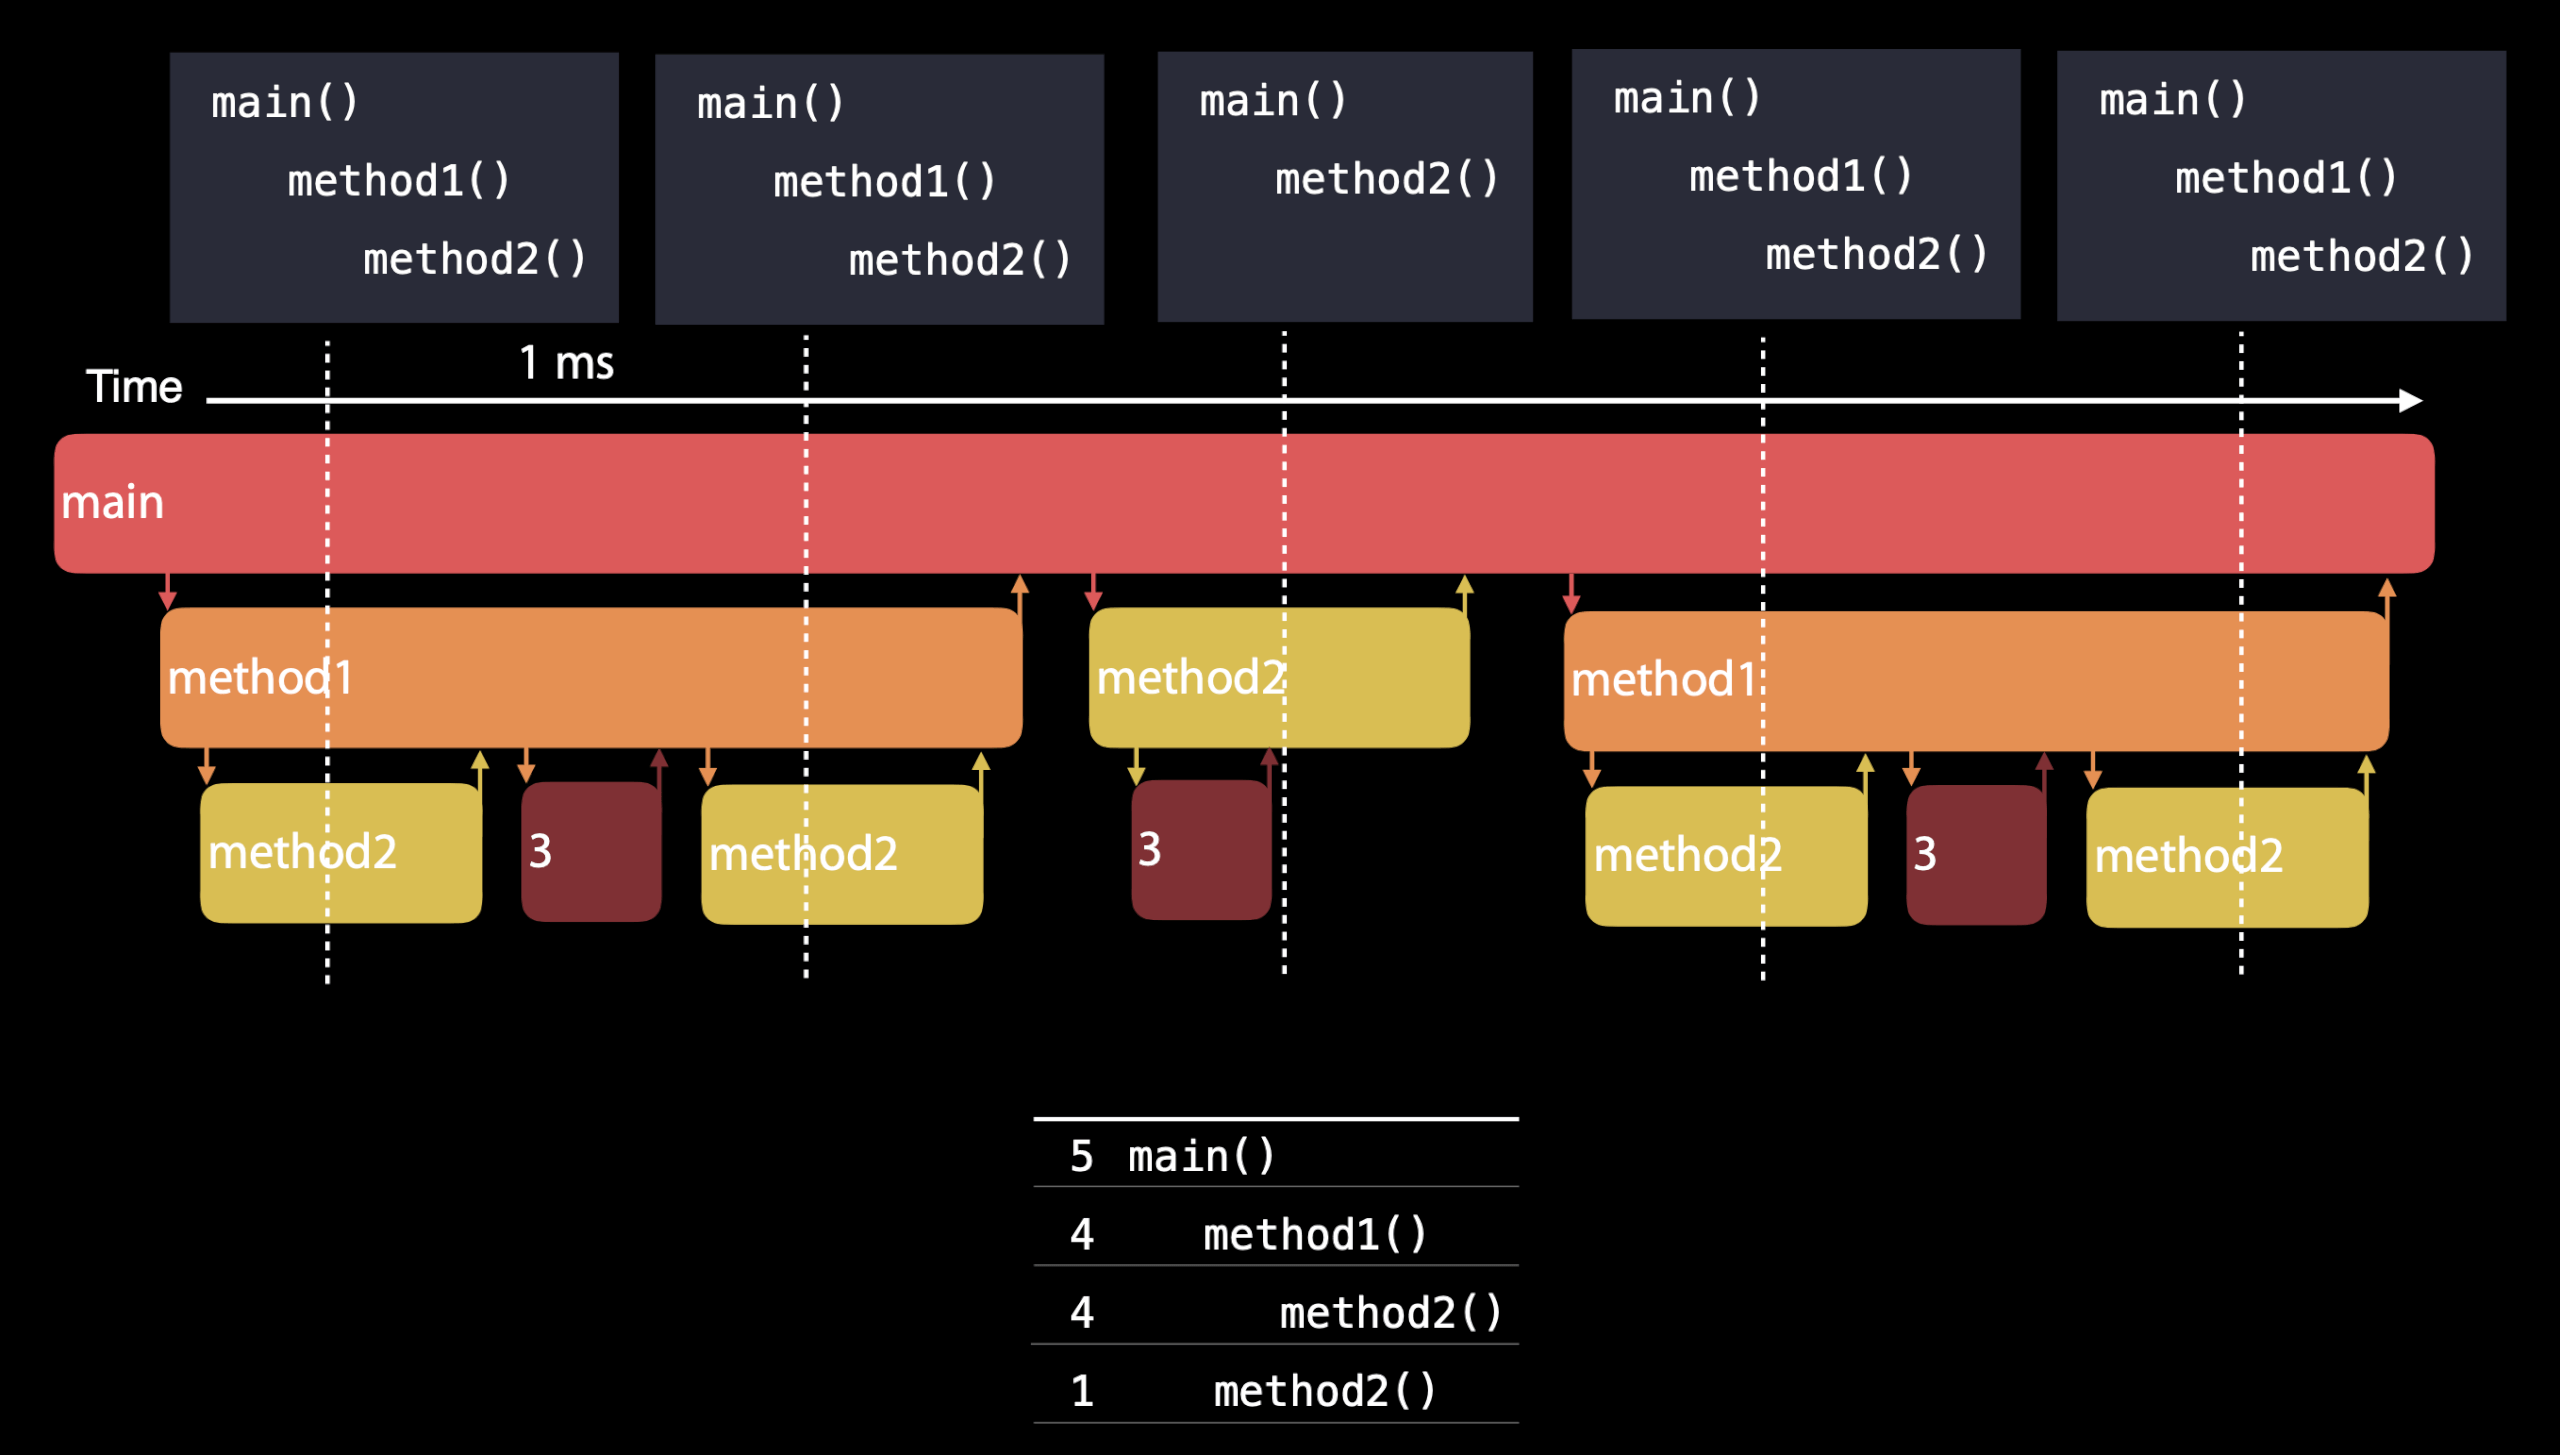
Time Profiler's not actually measuring duration. It's not recording when the method starts, and then when it exits. It's aggregating the samples into a useful summary. So when you see time values in Time Profiler, that's the number of samples multiplied by the time between samples, which is 1 millisecond in most cases.(样本数量乘以样本时间间隔)
This does have some side effects. First, it doesn't distinguish between long running methods, and much faster methods that are called repetitively. Second, it doesn't necessarily capture everything. If you have really fast functions that aren't called very often, they won't appear in your call tree. But this is actually okay because they're not having an impact in how much work I have to be doing over time.
Tail Call Elimination
You notice when CGContextDrawPath returns, drawRect: returns. The way it returns is it pops the stack frame, restores the previous value of the frame pointer and jumps back to the caller. The compiler makes optimization here. It's going to pop the drawRect: stack frame, restore the frame pointer and make a direct call back into CGContextDrawPath. From CGContextDrawPath's perspective it was called directly from drawLayer:inContext: from UIKit.
This is called Tail Call Elimination who has some benefits. It saves stack memory. In the process of saving stack memory, it keeps the caches hot, that reuses the memory, the caches and data. It has a profound effect on recursive code, especially tail call recursive code, where a function or method calls itself as the last thing and then returns.
If you want to turn it off to show a cleaner stack trace you can turn it off by going in the build settings of the project and setting the compiler flag, the CFLAGS=-fno-optimize-sibling-calls.
objc_msgSend
objc_msgSend implicitly gets inserted by the compiler whenever you use the square bracket notation or whenever you use the dot notation to access a property on an object. Its purpose is to look up the method implementation for the selector and invoke that method. That's how we do dynamic dispatch in Objective-C. objc_msgSend is extremely fast and does not push a stack frame.
通过实测发现,objc 的消息发送消耗了一定的 CPU 时间,我们希望优化这部分时间。Method caching was not as fast as inlining. What we really want in this case is that small method body to be inlined. You have alternatives: use C or C++. However, Swift is more ideal, because unlike Objective-C it is only dynamic when it needs to be. If you make sure that the performance critical classes are internal and you use whole module optimization, the compiler or the whole tool chain can determine when there's only one method implementation and inlines it right into the call site giving you some significant wins especially on the iterator case.
火焰图
火焰图是基于函数调用堆栈信息生成的 SVG 图片。
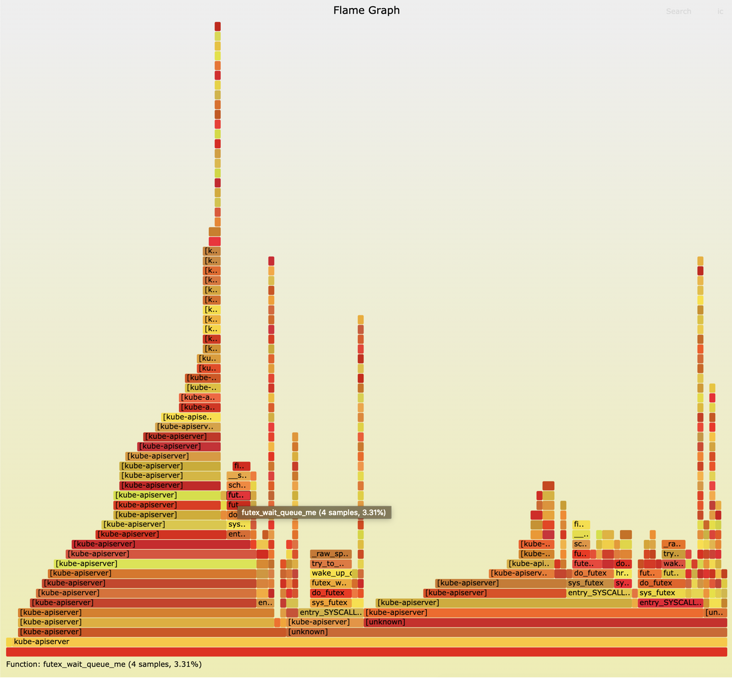
x 轴表示抽样数,如果一个函数在 x 轴占据的宽度越宽,就表示它被抽到的次数多,即执行的时间长。注意,x 轴不代表时间,而是所有的调用栈合并后,按字母顺序排列的。
颜色没有特殊含义,因为火焰图表示的是 CPU 的工作,所以一般选择暖色调。
Responsiveness
The way your application works, is the main thread that does all the user interface work. It's responsible for responding to user input, and then updating your views. The main thread has a runloop that's just watching a queue called an Event Queue and waiting for events to appear on it. When an event appears, it sends it to your UIApplication instance, which then passes the event down through the responder chain in your application.
When busy, the main thread can't process the queue. And then as a result, you get stuttering and hiccups. So it's really important to keep your main thread free, so it's able to respond to the user input in a very quick manner.
Every thread or every application on the system starts with a single thread called the main thread. This thread is special, and it has a few primary purposes. That is to handle input and to update your interface (drawing views, doing layout, or animating). If you're doing other things on your main thread, such as executing lengthy tasks like expensive image processing, that will keeps your main thread busy, which means it won't be idle, you won't be able to respond to input, or update your UI. Additionally, you should avoid doing I/O on your main thread.
I/O
The main system resources are CPU, memory, and I/O. Operations that interact with the file system and deal with reading or writing files are generally considered an I/O. Talking to a web server is a good example of network-based I/O. When your app is using I/O, it runs code on the CPU, accesses memory, and ultimately saves data to or fetches data from the disk. If the network is involved, the network-based radios are interacted with as well. The combined power cost of all of these competents makes I/O a heavy operation in terms of battery usage.
Best practices:
- Caching: Do caching but make balance between memory usage and disk I/O. Just like I/O, memory is a shared and limited resource in the system that you should be careful. We recommend using the
NSCacheAPIs since they handle memory pressure conditions appropriately. - Coalescing I/Os: Collects a bunch of updates that were frequently done, and write them out as a single I/O operation.
To debug:
- Xcode - Run - Debug Navigator - Disk
- Instruments - Template: Blank - Add Library: Disk Usage
XCTest Metrics
CPU, memory, storage, clock and OSSignpost.
// This test measures time, memory, and CPU impact
func testPhotoUploadPerformance() {
    let app = XCUIApplication()
    measure(metrics: [XCTClockMetric(),
                      XCTMemoryMetric(application: app),
                      XCTCPUMetric(application: app)]) {
                        app.buttons["Apply Effect"].tap()
                        app.dialogs["alert"].buttons["OK"].tap()
    }
}
Because XCTest works so well with both Xcode and Xcode server, you could use this performance test both in your development and testing phase and also as part of your continuous integration system and ensure that your app doesn't regress on the performance.
MetricKit
With MetricKit, you can receive on-device app diagnostics and power and performance metrics captured by the system. A registered app receives reports containing data about the previous 24 hours at most once per day. Over the course of the day, the operating system is passively aggregating performance data for your app as it is used. This data is anonymized and designed to protect user privacy.
It's up to you to take any actions once you receive this payload on the device. For example, you can choose to save it to a file, or you can also upload to your server so you can collect this from the field for multiple users.
import MetricKit

class MySubscriber: NSObject, MXMetricManagerSubscriber {
    var metricManager: MXMetricManager?
    override init() {
        super.init()
        metricManager = MXMetricManager.shared
        metricManager?.add(self)
    }
    override deinit() {
        metricManager?.remove(self)
    }
    func didReceive(_ payload: [MXMetricPayload]) {
        // new in iOS 13
    }
    func didReceive(_ payload: [MXDiagnosticPayload]) {
        // new in iOS 14
    }
}
App Store Connect API
WWDC 2020 - Identify trends with the Power and Performance API
We introduced our new App Store Connect API for power and performance. With this new API, you can programmatically access the same metrics and diagnostics data as Xcode Organizer, and build customized data analytics and monitoring systems around power and performance metrics. We also introduced smart insights that can help you identify key trends and regression in metrics.
API resources:
- metrics and insights for recent app versions:
GET /v1/apps/{id}/perfPowerMetrics - metrics for specific app version
- diagnostic signatures for specific app version:
GET /v1/builds/{id}/diagnosticSignatures - diagnostic logs per signature:
GET /v1/diagnosticSignatures/{id}/logs
There are two parts to power and performance diagnostics.
First, we use diagnostic signatures to group similar problems together. For instance, similar disk writes exceptions are aggregated to generate disk writes signatures. Using diagnostic signatures, we can do root cause analysis by problem group. The API returns most prevalent top signatures for your app version, and given a top signature and its ID, you can get related diagnostic logs with more details.
The second part is diagnostic log. It contains anonymized diagnostic details from individual devices. And this includes metadata information, such as platform, OS version and device type. And also, the log contains function call stack trees, which can be extremely helpful to understand what is causing the power and performance hotspots. The diagnostic call stack JSON structure is also shared with MetricKit.