内存
基础知识
内存是一个巨大的字节数组,每个字节都有它的地址。操作系统通常在高地址区。
进程的内存布局是操作系统为每个运行中的程序分配和管理的虚拟地址空间的结构,主要由代码段、数据段、堆、栈组成。
进程只能访问自己的地址空间,分页就是把地址空间切分成固定大小的单元。最新的 iOS 设备,物理内存分页和虚拟内存分页都是 16KB 大小。
进程使用的地址称为逻辑地址或虚拟地址,RAM 中的地址称为物理地址。虚拟地址页到物理地址页的转换,是通过 CPU 里的一个硬件单元 MMU 实现的。每个进程会有一个分页表记录这个对应关系,在进程调度的上下文切换阶段会做页表的切换。
32 位进程可寻址的地址范围是 2^32 等于 4GB;64 位进程可寻址的范围是 2^64 约等于 18EB。从开发者的角度看,所有 18EB 的虚拟内存空间都是可用的!但如果进程访问了一个不在物理内存中的分页,那么就会发生 page fault,操作系统会将磁盘中的分页读入到主存。
分页交换:内存分页在物理磁盘和主存间交换。
Addresses in the source program are generally symbolic. A compiler typically binds these symbolic addresses to relocatable addresses (such as "14 bytes from the beginning of this module"). The linker or loader in turn binds the relocatable addresses to absolute addresses (such as 74014).
Jetsam event
Identifying high-memory use with jetsam event reports | Apple Developer Documentation
iOS, iPadOS, watchOS, and tvOS have a virtual memory system that relies on all apps releasing memory when the operating system encounters memory pressure, where available memory is low and the system can’t meet the demands of all running apps. Under memory pressure, apps free memory after receiving a low-memory notification. If all running apps release enough total memory to alleviate memory pressure, your app will continue to run. But, if memory pressure continues because apps haven’t relinquished enough memory, the system frees memory by terminating applications to reclaim their memory. This is a jetsam event, and the system creates a jetsam event report with information about why it chose to jettison an app.
The pageSize field in the report header records the number of bytes in each memory page. Pages are typically 16KB in size.
To determine the amount of memory your app is using, multiply the number of memory pages reported in the rpages field by the page size value from the pageSize field in the report’s header.
largestProcess field: names the process using the highest number of memory pages on the system.
Search for the reason key to identify the jettisoned process and why the system jettisoned it. Only the jettisoned process has the reason key.
通过 Jetsam 文件来查看内存分页大小、占用内存最大的进程、每个进程占用的内存、被杀死的进程以及它被杀死的原因。还可以知道在具体机型上,操作系统给每个进程的内存上限是多少。
iOS Memory Deep Dive
A typical app, their memory footprint and profile has a dirty, a compressed, and a clean segment of memory.
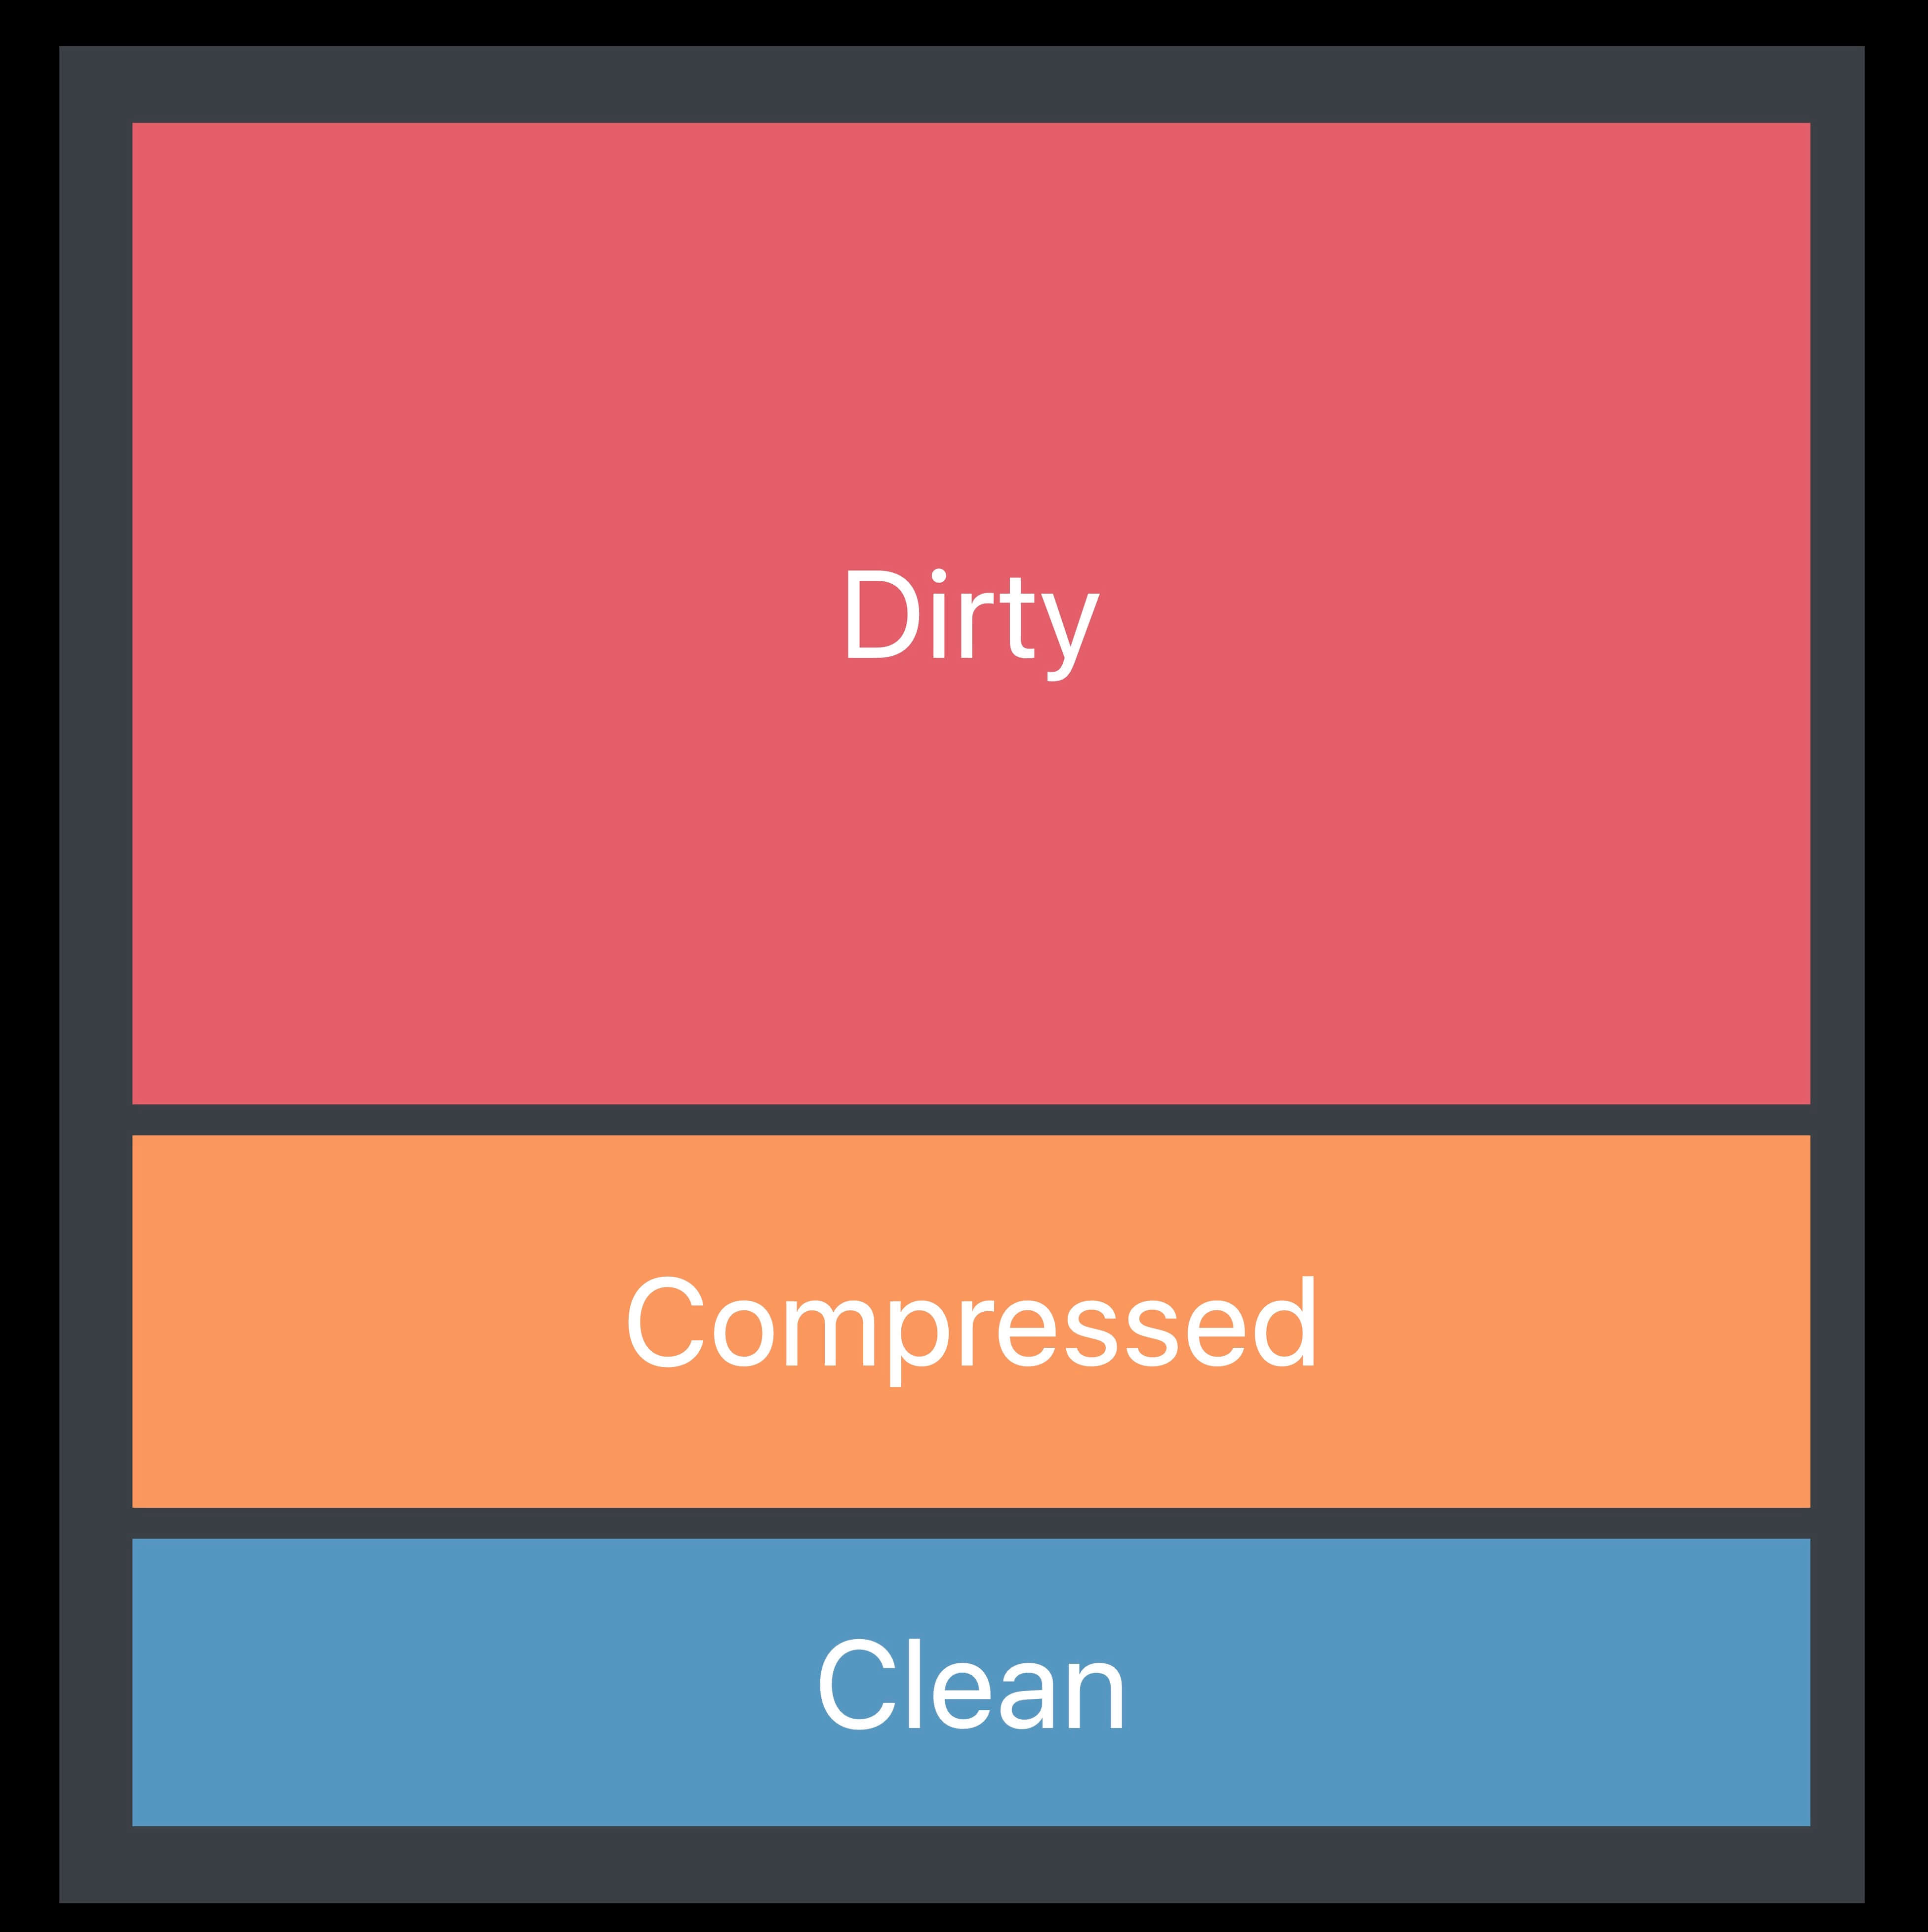
When we talk about the app's memory footprint, we're really talking about the dirty and compressed segments. Clean memory doesn't really count.
When you exceed the footprint, you will get a EXC_RESOURCE_EXCEPTION.
Clean memory is data that can be paged out. Memory-mapped files are files on disk and loaded in the memory. If you use read-only files, these are always going to be clean pages. These could be images, data blobs, training models, and frameworks.
Dirty memory is any memory that has been written to by your app. It can be decoded image buffers, objects, or anything that has been malloced.
Compressd memory: iOS doesn't have a traditional disk swap system. Instead, it uses a memory compressor introduced in iOS 7. The memory compressor will take unaccessed pages and squeeze them down, which can actually create more space. But on access, the compressor will then decompress them so the memory can be read. Prefer NSCache to NSDictionary to cache objects!
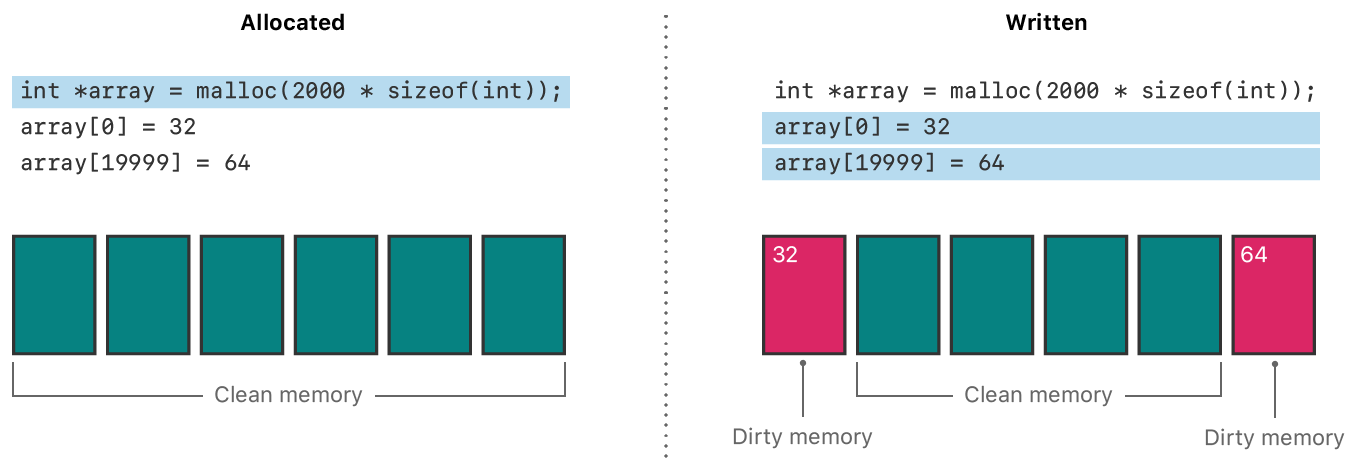
So as an example of clean and dirty pages, let's say I allocate an array of 20,000 integers.
// The system may give me six pages. Now, these pages are clean when I allocate them.
int *array = malloc(20000 * sizeof(int));
// If I write to the first place in this array, that page has become dirty.
array[0] = 32;
// Similarly, if I write to the last page, that, or the last place in the buffer, the last page becomes dirty as well.
array[19999] = 64;
Dirty memory is much more expensive than clean memory. Clean memory can be evicted to make room for other things because you if you need it later, the system can always just reload it from disk. macOS has the option to swap out dirty memory, but dirty memory is especially costly in iOS because it doesn’t use swap.
内存警告
在收到内存警告时可以通过 task_info 获取当前占用内存大小,来判断系统给予 App 的内存阈值。
#import <mach/mach.h>
- (void)viewDidLoad {
    [super viewDidLoad];

    task_vm_info_data_t info;
    mach_msg_type_number_t size = TASK_VM_INFO_COUNT;
    kern_return_t kerr = task_info(mach_task_self(), TASK_VM_INFO, (task_info_t)&info, &size);
    if (kerr == KERN_SUCCESS) {
        // info.phys_footprint 表示实际使用的物理内存
        mach_vm_size_t totalSize = info.internal + info.compressed; // 与 Xcode 显示的内存占用一样
        NSLog(@"Memory in use (in bytes): %llu", totalSize);
    }
}

- (void)didReceiveMemoryWarning {
    [super didReceiveMemoryWarning];

    struct mach_task_basic_info info;
    mach_msg_type_number_t size = MACH_TASK_BASIC_INFO_COUNT;
    kern_return_t kr = task_info(mach_task_self(), MACH_TASK_BASIC_INFO, (task_info_t)&info, &size);
    if (kr == KERN_SUCCESS) {
        NSLog(@"Memory in use (in bytes): %llu", info.resident_size); // resident memory size (bytes)
    }
}
Mapping Files Into Memory
File mapping is the process of mapping the disk sectors of a file into the virtual memory space of a process. Once mapped, your application accesses the file as if it were entirely resident in memory. As you read data from the mapped file pointer, the kernel pages in the appropriate data and returns it to your application.
File mapping is effective in the following situations:
- You have a large file whose contents you want to access randomly one or more times.
- You have a small file whose contents you want to read into memory all at once and access frequently. This technique is best for files that are no more than a few virtual memory pages in size.
- You want to cache specific portions of a file in memory. File mapping eliminates the need to cache the data at all, which leaves more room in the system disk caches for other data.
You should not use file mapping in the following situations:
- You want to read a file sequentially from start to finish only once.
- The file is several hundred megabytes or more in size. (Mapping large files fills virtual memory space quickly. In addition, your program may not have the available space if it has been running for a while or its memory space is fragmented.)
- The file is located on a removable drive.
- The file is located on a network drive.
void ProcessFile(char *inPathName) {
    size_t dataLength;
    void *dataPtr;
    char *appendStr = " Happy new year!!";
    int appendSize = (int)strlen(appendStr);
    if(MapFile(inPathName, &dataPtr, &dataLength, appendSize) == 0) {
        // process the data
        dataPtr += dataLength; // 指针移动到文件的末尾
        memcpy(dataPtr, appendStr, appendSize);
        // unmap the file
        munmap(dataPtr, dataLength + appendSize);
    }
}

int MapFile(char *inPathName, void **outDataPtr, size_t *outDataLength, size_t appendSize) {
    int outError;
    int fileDescriptor;
    struct stat statInfo;

    // Return safe values on error.
    outError = 0;
    *outDataPtr = NULL;
    *outDataLength = 0;

    // Open the file.
    fileDescriptor = open(inPathName, O_RDWR, 0);
    if(fileDescriptor < 0) {
        outError = errno;
    } else {
        // We now know the file exists. Retrieve the file size.
        if(fstat(fileDescriptor, &statInfo) != 0) {
            outError = errno;
        } else {
            ftruncate(fileDescriptor, statInfo.st_size + appendSize);
            fsync(fileDescriptor);
            *outDataPtr = mmap(NULL,
                               statInfo.st_size + appendSize,
                               PROT_READ|PROT_WRITE,
                               MAP_FILE|MAP_SHARED,
                               fileDescriptor,
                               0);
            if(*outDataPtr == MAP_FAILED) {
                outError = errno;
            } else {
                // On success, return the size of the mapped file.
                *outDataLength = statInfo.st_size;
            }
        }

        // Now close the file. The kernel doesn’t use our file descriptor.
        close(fileDescriptor);
    }
    return outError;
}
Xcode’s Debug navigator
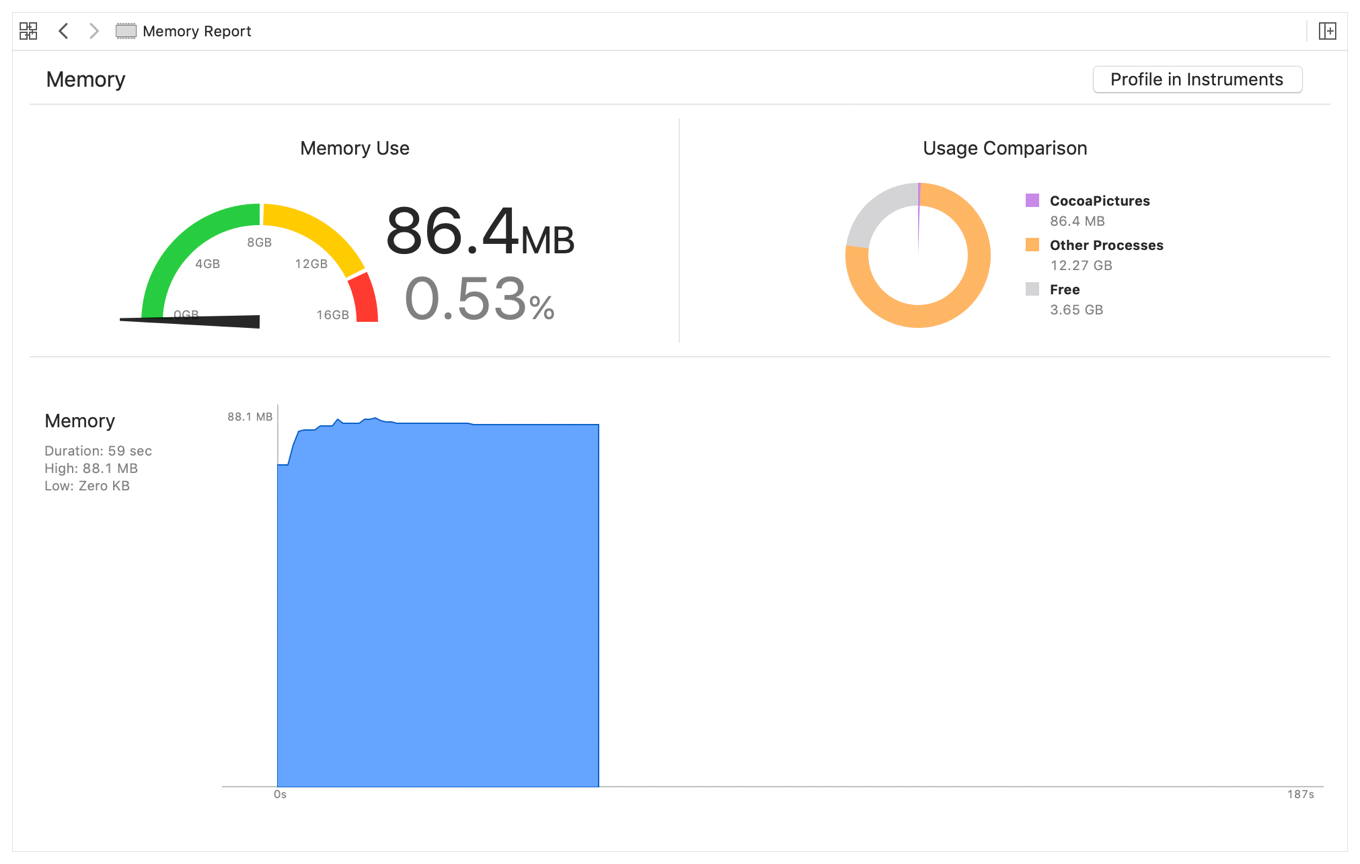
黄色区域代表可能触发内存警告;红色区域代表可能被终止进程。
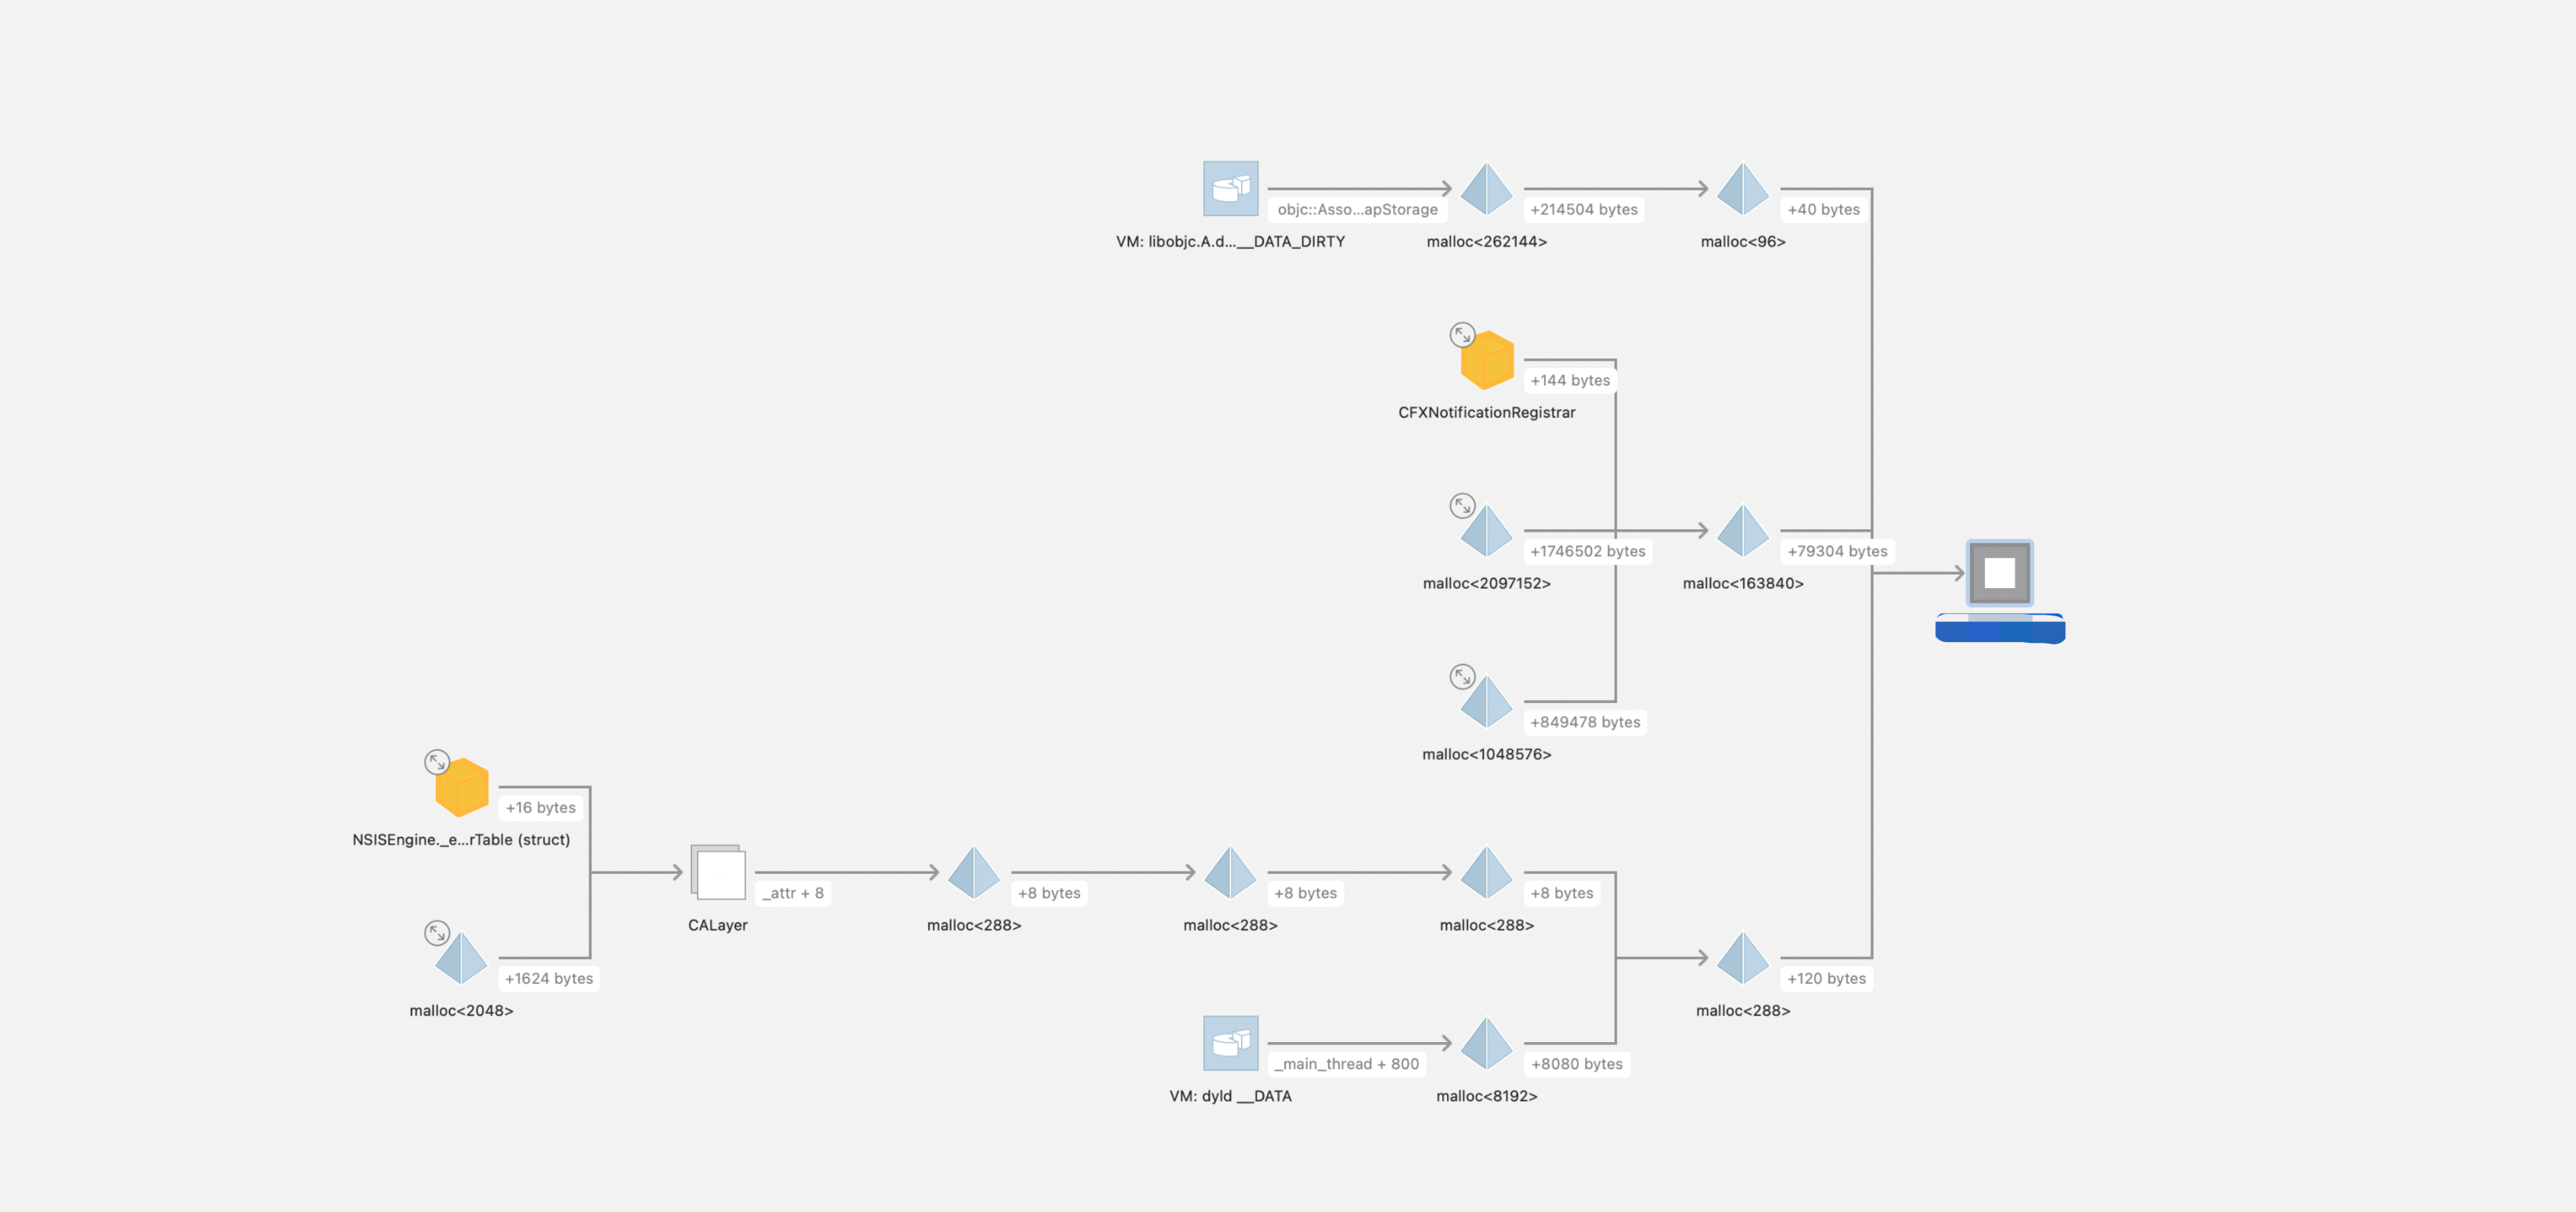
Memory Graph
在 Xcode 中导出 memgraph:先 Debug Memory Graph,然后 File - Export Memory Graph。
通过 vmmap 命令可以很方便地查看一个 App 的内存整体使用情况。
vmmap App.memgraph
vmmap --summary App.memgraph
heap --sortBySize App.memgraph 可以打印出各个类占用内存的情况。
heap App.memgraph -addresses all | <classes-pattern> 可以将某个类名的内存地址都显示出来。
如果在调试的时候我们 Malloc Stack,就可以查到每个对象创建时的调用堆栈:
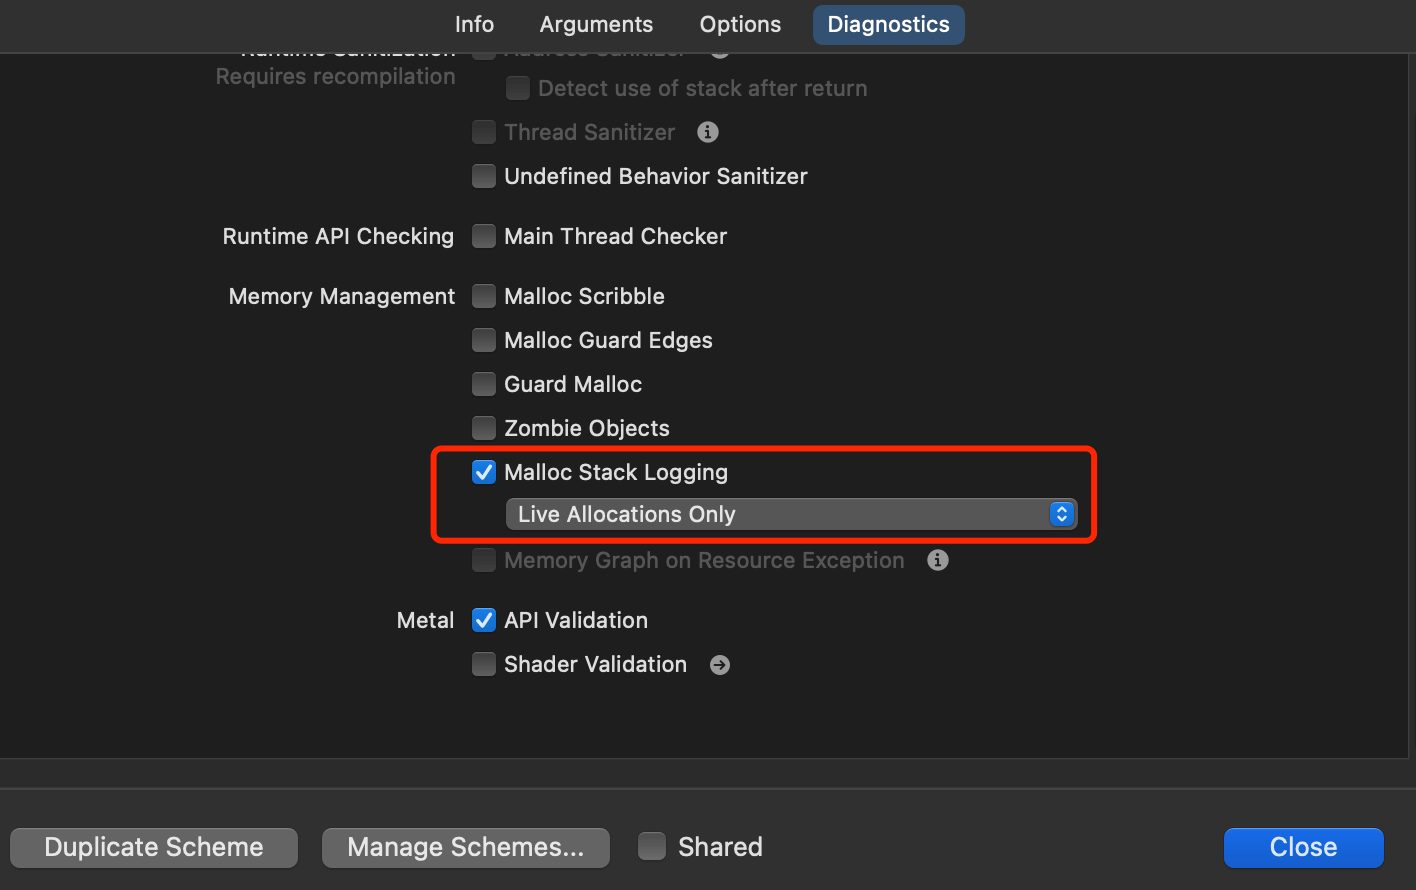
malloc_history App.memgraph [address] 可以看到指定地址内存分配时的堆栈。
在 Memory Graph 所有的强引用都是黑色实线,而灰色实线并不是弱引用,只是一些�系统级别的引用或者苹果为了优化显示效果而添加的,所以在看到灰色的引用时,就自动忽略它吧。
有些 UIView 实例没有实现引用的,可能是系统持有了,要使用 -[UIView removeFromSuperview] 移除掉。
Timer 引起的循环引用
下面这段 NSTimer 存在循环引用 (self -> timer -> self)。
注意,即使我们使用 __weak typeof(self) weakSelf = self; 也没有用,因为 NSTimer 的内部实现会强引用 self,造成循环引用。
@interface TimerViewController ()
@property(nonatomic, strong) NSTimer *timer;
@end

@implementation TimerViewController
- (void)viewDidLoad {
    [super viewDidLoad];
    __weak typeof(self) weakSelf = self;
    self.timer = [NSTimer scheduledTimerWithTimeInterval:1.0 target:weakSelf selector:@selector(testPrint) userInfo:nil repeats:YES];
    [[NSRunLoop mainRunLoop] addTimer:self.timer forMode:NSRunLoopCommonModes];
}

- (void)testPrint {
    NSLog(@"hello");
}

- (void)dealloc {
    NSLog(@"dealloc");
    [self.timer invalidate]; // dealloc 方法不会被调用到
}
@end
解决方式一,采用中间类,VC -> timer -> timerTarget -> weakSelf 解除循环引用:
@interface TimerTarget : NSObject
+ (NSTimer*)scheduledTimerWithTimeInterval:(NSTimeInterval)interval target:(nonnull id)aTarget selector:(nonnull SEL)aSelector userInfo:(nullable id)userInfo repeats:(BOOL)yesOrNo;

@property (assign, nonatomic) SEL outSelector;
@property (weak, nonatomic) id outTarget;

@end

@implementation TimerTarget

+ (NSTimer*)scheduledTimerWithTimeInterval:(NSTimeInterval)interval target:(id)aTarget selector:(SEL)aSelector userInfo:(id)userInfo repeats:(BOOL)yesOrNo {
    TimerTarget *target = [[TimerTarget alloc]init];
    target.outSelector = aSelector;
    target.outTarget = aTarget;
    NSTimer *timer = [NSTimer scheduledTimerWithTimeInterval:interval target:target selector:@selector(timerSelector:) userInfo:userInfo repeats:yesOrNo];
    return timer;
}

- (void)timerSelector:(NSTimer*)timer {
    if (self.outTarget && [self.outTarget respondsToSelector:self.outSelector]) {
        [self.outTarget performSelector:self.outSelector withObject:timer.userInfo];
    } else {
        [timer invalidate];
    }
}

@end
解决方式二,使用 block,VC -> timer -> block -> weakSelf 解除循环引用,在 iOS 10+ 上已经有这个 API 了:
__weak typeof(self) weakSelf = self;
self.timer = [NSTimer scheduledTimerWithTimeInterval:1.0 repeats:YES block:^(NSTimer * _Nonnull timer) {
    [weakSelf testPrint];
}];
解决方式三,使用 NSProxy:
@interface MyProxy : NSProxy
- (instancetype)initWithTarget:(id)target;
@property (weak, readonly, nonatomic) id weakTarget;
@end

@implementation MyProxy
- (instancetype)initWithTarget:(id)target {
    _weakTarget = target;
    return self;
}

- (void)forwardInvocation:(NSInvocation *)invocation {
    SEL sel = [invocation selector];
    if (_weakTarget && [self.weakTarget respondsToSelector:sel]) {
        [invocation invokeWithTarget:self.weakTarget];
    }
}

- (NSMethodSignature *)methodSignatureForSelector:(SEL)sel {
    return [self.weakTarget methodSignatureForSelector:sel];
}

- (BOOL)respondsToSelector:(SEL)aSelector {
    return [self.weakTarget respondsToSelector:aSelector];
}
@end
调用:
self.timer = [NSTimer scheduledTimerWithTimeInterval:1.0 target:[[MyProxy alloc]initWithTarget:self] selector:@selector(testPrint) userInfo:nil repeats:YES];
虚拟内存
看下面的一个内存导致的崩溃,JSC 在使用 bmalloc 尝试进行内存分配时,提示 OOM 导致了 SIGTRAP。
Last Exception :
0  JavaScriptCore                 0x000000018b777570 _pas_panic_on_out_of_memory_error
1  JavaScriptCore                 0x000000018b72e918 _bmalloc_try_iso_allocate_impl_impl_slow
2  JavaScriptCore                 0x000000018b73d3d8 _bmalloc_heap_config_specialized_local_allocator_try_allocate_small_segregated_slow +  5952
3  JavaScriptCore                 0x000000018b7276f8 _bmalloc_allocate_impl_casual_case +  800
按照常规的理解,当 App 内存不足的时候,正常会触发系统的 Jetsam 机制杀死 App。在系统日志中会留下 Jetsam 相关日志,理论上不会在 Bugly 等异常上报中发现。但这一类崩溃却一直在产生上报,并且低内存的崩溃堆栈表现形式有很多种。(看经验来识别?)虽然堆栈上有明确的原因说明是 OOM,但我们观察到有不少用户实际上物理内存空间还是足够的,例如 633MB。
翻阅相关 JavaScriptCore、DartVM 等虚拟机的内存管理相关代码,可以找到底层的内存分配基本实现都是基于 mmap 实现的。虽然 mmap 主要用于文件映射,但也可以用于分配匿名内存。通过指定特殊的参数(MAP_ANONYMOUS 或 MAP_ANON),mmap 可以创建一段与任何文件都不关联的内存区域,用于动态分配内存。这种方式在某些情况下比传统的 malloc 函数分配内存更灵活。
MAP_ANONYMOUS: 表示分配匿名内存(不与文件关联)。
mmap 通过系统调用将一个文件或设备的内容映射到进程的虚拟地址空间中。mmap 能分配的内存受到设备的最大虚拟内存限制。
根据 XNU 内核源码和开发者实践验证,iOS 对单个进程的虚拟内存地址空间确实存在硬件相关的动态限制。当设备 RAM 小于 3GB 时,虚拟地址空间上限为 9.375GB,这一限制源于 XNU 内核中 pmap.c 文件的内存分配机制。
Size Matters: An Exploration of Virtual Memory on iOS | Always Processing
pmap.c 中还透露了内核内存分配存在 jumbo 机制。当 iOS App 带有指定的能力声明时,xnu 内核将会以 jumbo 模式运行,虚拟内存地址空间将会直接分配为最大值 64GB:
iOS 14.0+ 可开启虚拟内存地址拓展。当开启 com.apple.developer.kernel.extended-virtual-addressing 时,内核的虚拟内存可分配空间有明显提升。
内存扩展前 malloc 失败阈值约 7065482 * 1009 = 6.63 GB
内存扩展后 malloc 失败阈值约 56753881 * 1009 = 53.33 GB
苹果在 iOS15 上��增加了 com.apple.developer.kernel.increased-memory-limit 的能力声明,实测在 iPhone 13 Pro 下可以增加 1GB 的可用物理内存。