启动时长优化
Mach-O
Image: An executable, dylib, or bundle.
A Mach-O image is divided into segments. Each segment is always a multiple of the page size. The page size is determined by the hardware, for arm64, the page size is 16KB.
The most common segment names are __TEXT, __DATA, __LINKEDIT:
__TEXTcontains the Mach header, machine instructions and read-only constants such as C strings__DATAsegment is read-write and contains global variables, static variables, etc__LINKEDITcontains information about your functions and variables such as their names and addresses, the "meta data" about how to load the program
You may also heard about Mach-O Universal Files, that's merged Mach-O images for different architectures.
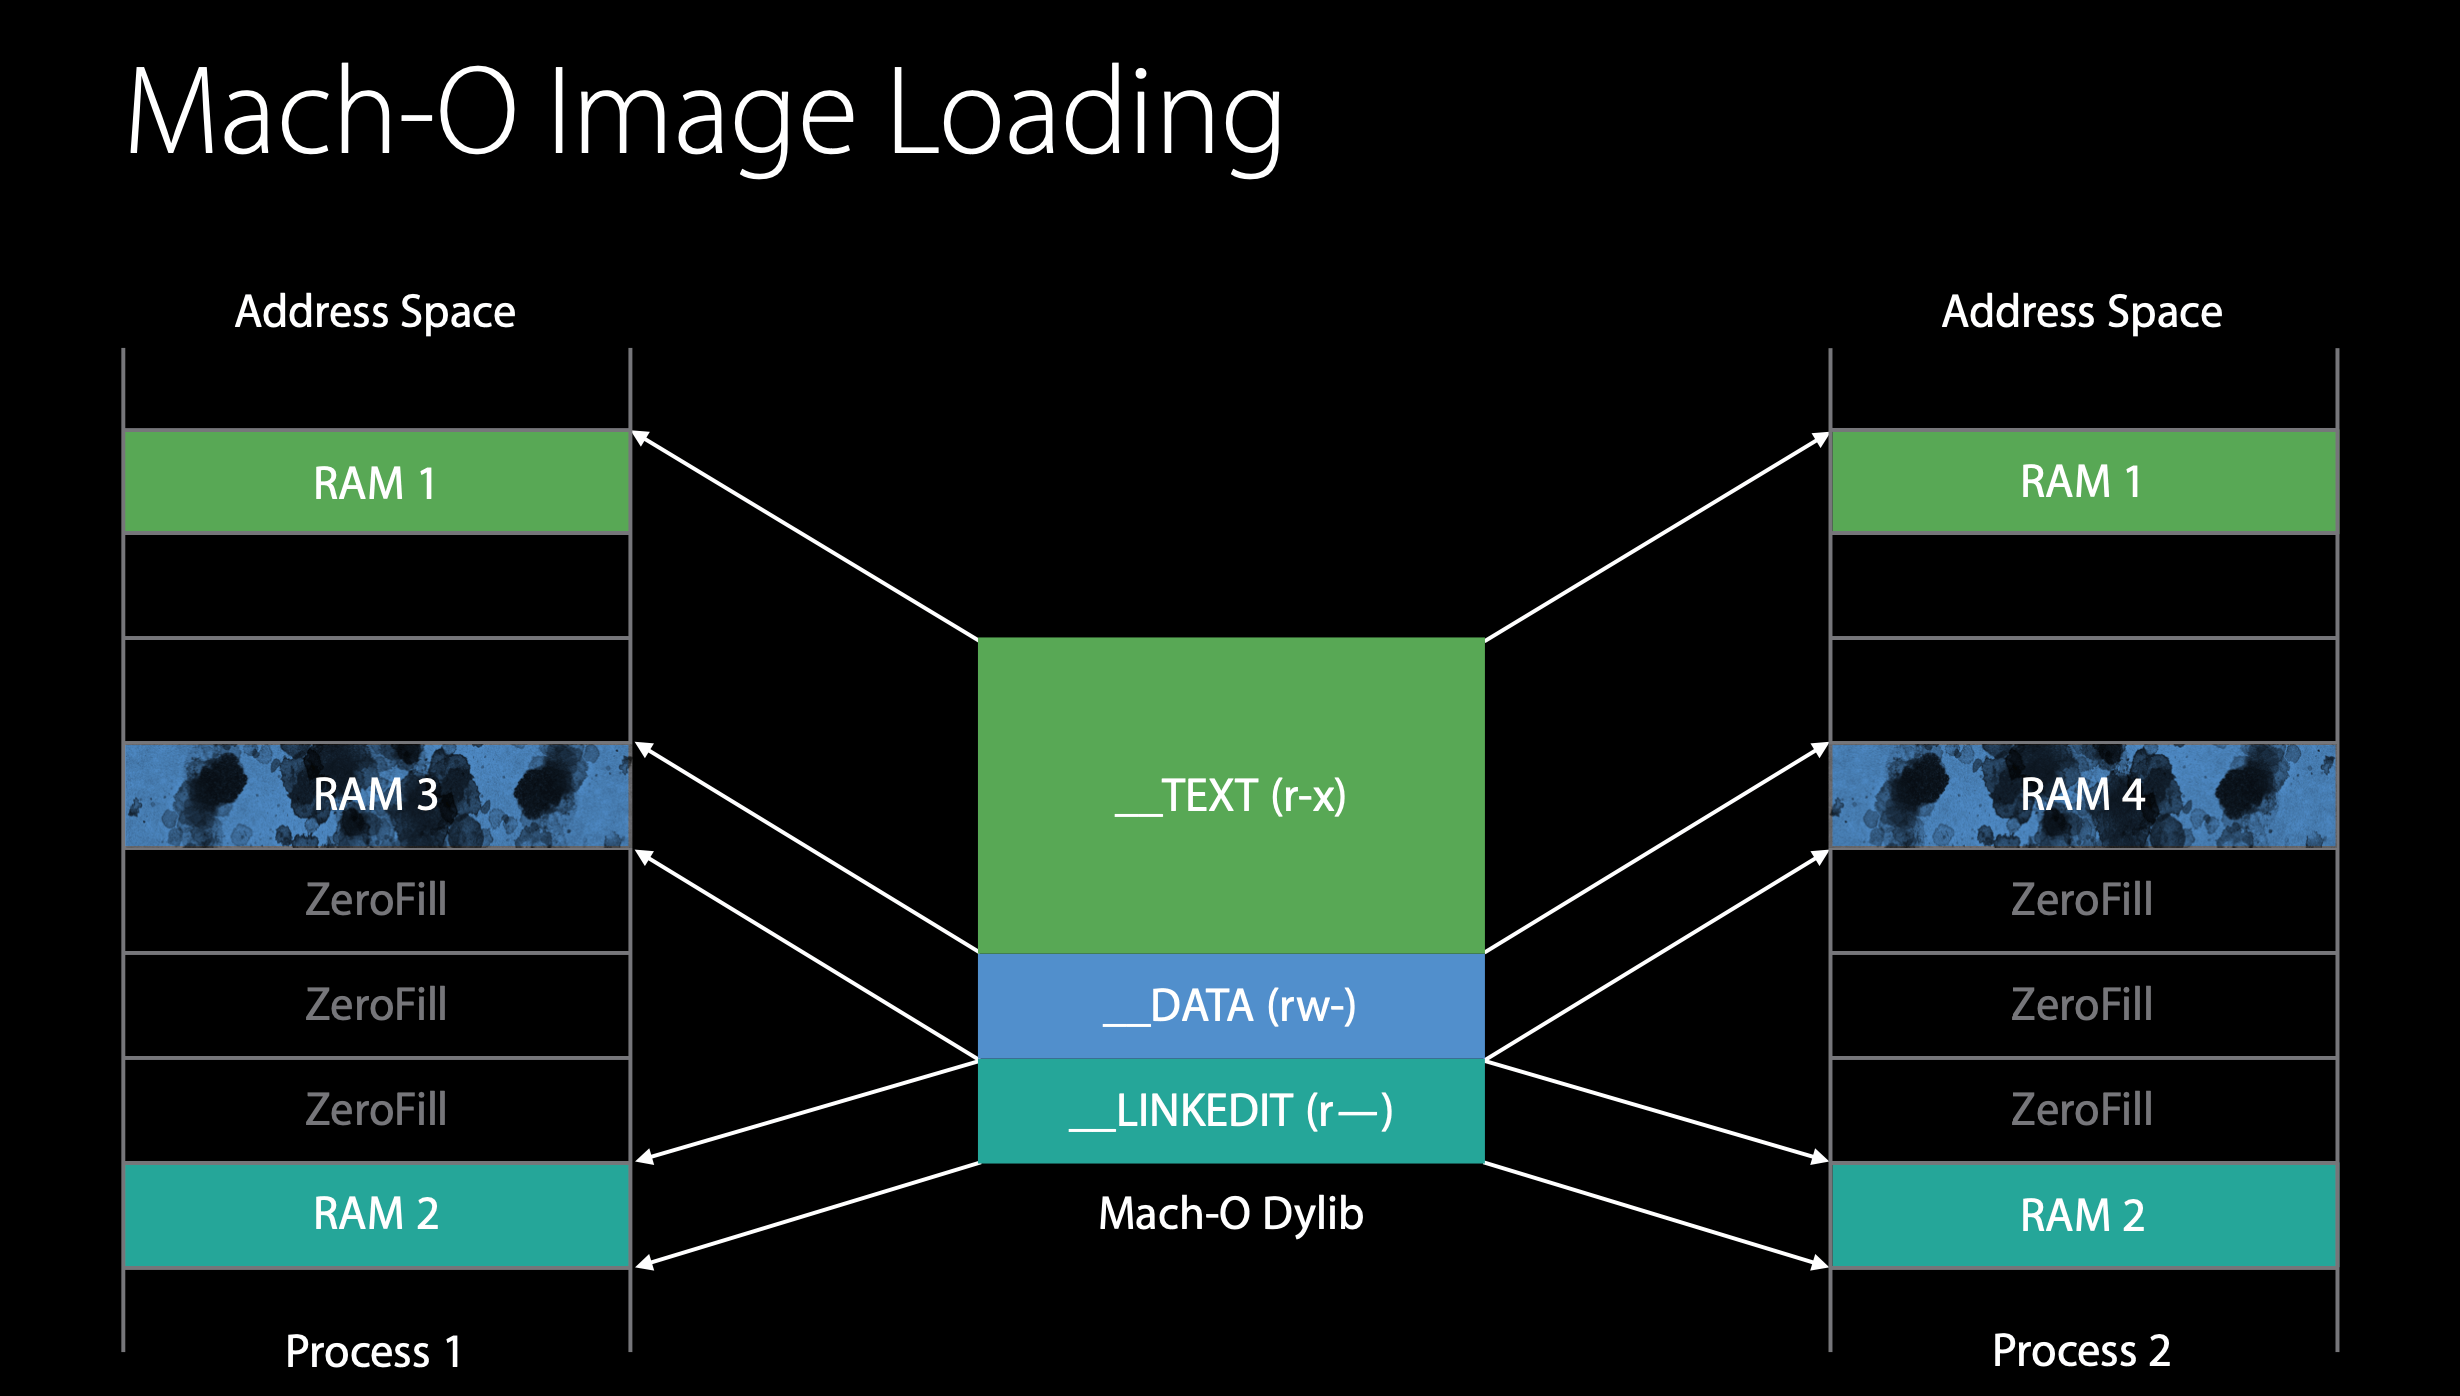
Every process has a logical address space which gets mapped to some physical page of RAM.
File backed mapping: rather than actually read an entire file into RAM you can tell the VM system through the mmap call, that I want this slice of this file mapped to this address range in my process. Each time you access an address that hasn't been accessed before it will cause a page fault, the kernel will read just that one page. And that gives you lazy reading of your file.
The __TEXT segment of any images can be mapped into VM, it will be read lazily, and all those pages can be shared between processes.
As soon as one process actually tries to write to __DATA segment page, the Copy-On-Write (COW) happens. The Copy-On-Write causes the kernel to make a copy of that page into another physical RAM and redirect the mapping to go to that. So that one process now has its own copy of that page, which brings us to clean versus dirty pages. That copy is considered a dirty page.
A dirty page is something that contains process specific information. A clean page is something that the kernel could regenerate later if needed such as re-reading from disk. So dirty pages are much more expensive than clean pages.
__LINKEDIT is only needed while dyld is doing its operations. Once it's done, it doesn't need these __LINKEDIT pages anymore, the kernal can reclaim them when someone else needs RAM.
You can mark a page readable, writable, or executable, or any combination of those.
There are two security things that have impacted dyld, ASLR and code signing. ASLR is that every time you loaded the images it may be at a different address. Code signing is at build time, every single page of your Mach-O file gets its own individual cryptographic hash. And all those hashes are stored in the __LINKEDIT. This allows each page to be validated that it hasn't been tampered with.
exec to main
exec() is a system call. When you trap into the kernel, you basically say I want to replace this process with this new program. The kernel wipes the entire address space and maps-in your executable.
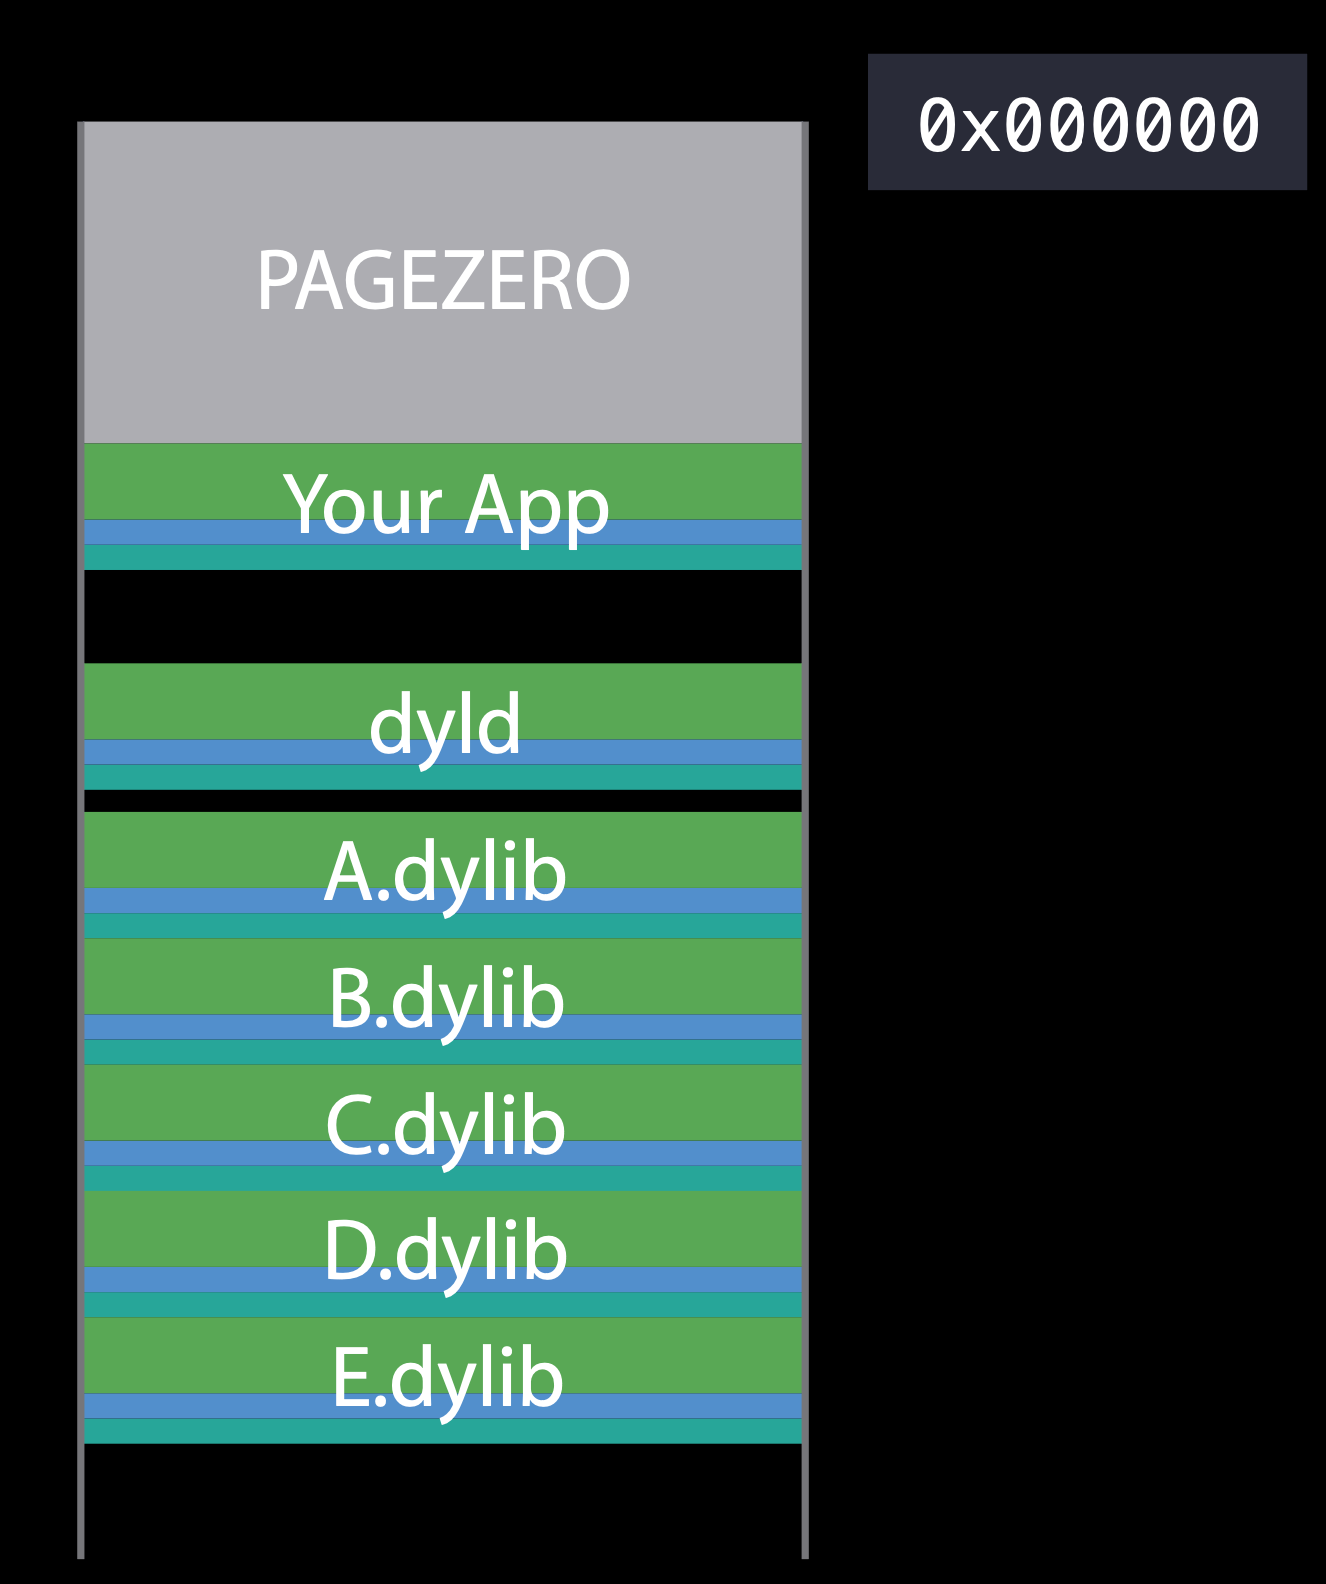
For ASLR the system maps your executable in at a random address. From that address, back down to zero, it marks that whole region (PAGEZERO) inaccessible. The size of that region is at least 4GB for 64-bit processes. This catches any NULL pointer references and pointer truncation errors.
When the kernel's done mapping a process, it now maps another Mach-O called dyld into that process at another random address, sets the PC (program counter) into dyld and let dyld load all the dylibs and get everything prepared.

First, dyld has to map all the dependent dylibs. To find those dylibs, it first reads the header of the main executable that the kernel already mapped in. That header has a list of all the dependent libraries. Once dyld found each dylib, it validate it, register that code signature to the kernel, then mmap each segment in that dylib. Each of the dylibs may depend on something that's already loaded or something need to load. Apps typically load 100 to 400 dylibs! Luckily most of those are OS dylibs which load very quickly because the OS do a lot of pre-calculate and pre-cache works.
Eventually, it has everything loaded, but now they're all independent of each other, we have to bind them together. But, because of code signing we can't actually alter instructions. So how does one dylib call into another dylib if you can't change the instructions? Modern code-gen is dynamic PIC (Position Independent Code), means code can run loaded at any address and is never altered. Actually, the co-gen creates pointers in the __DATA segment that point to implementation. The dyld is going to fix up pointers and data (in __DATA sengment).
There're two main categories of fix-ups, rebasing and binding.
Rebasing is adjusting pointers to within an image. It means going through all your data pointers and adding a slide to them (because of ASLR). Location of those relocatable addresses is encoded in __LINKEDIT. When we start doing rebasing, we're actually causing page faults to page in all the __DATA pages. And then we cause copy and write as we're changing them. So rebasing can sometimes be expensive because of all the I/O.(这就解释了为什么 __DATA sengment 在内存中是脏分页)
Binding is setting pointers to outside image. All references to something in another dylib are symbolic. So dyld needs to find the implementation of that symbol by looking through symbol tables. Once it's found, that values is stored in that data pointer. This is more computationally complex than rebasing is. But there's very little I/O because rebasing has done most of the I/O already.
To see fix-ups:
> xcrun dyldinfo -rebase -bind -lazy_bind myapp.app/myapp
Next, a few extra things that ObjC Runtime requires:
- All ObjC class definitions are registered with a global table.
- Non-fragile ivars offsets updated.
- Categories are inserted into method lists, including those not in your executable but in other dylibs.
objc_msgSendis based on selectors being unique so we need unique selectors.
Finally, before jumping to main, we have to run initializers:
- C++ compiler generates initializer for statically allocated objects
- ObjC
+loadmethods
Measurement
We have a built-in measurement in dyld, you can access it through setting an environment variable. (Xcode - Edit Scheme - Arguments - Environment Variables, DYLD_PRINT_STATISTICS=1, DYLD_PRINT_STATISTICS_DETAILS=1)
Total pre-main time: 1.3 seconds (100.0%)
         dylib loading time: 1.0 seconds (74.7%)
        rebase/binding time:  95.79 milliseconds (7.1%)
            ObjC setup time:  41.65 milliseconds (3.0%)
           initializer time: 202.46 milliseconds (15.0%)
           slowest intializers :
             libSystem.B.dylib :   7.37 milliseconds (0.5%)
           libMTLCapture.dylib :  36.40 milliseconds (2.7%)
                       Flutter :  79.66 milliseconds (5.9%)

  total time: 2.4 seconds (100.0%)
  total images loaded:  656 (584 from dyld shared cache)
  total segments mapped: 221, into 63664 pages
  total images loading time: 2.0 seconds (84.9%)
  total load time in ObjC:  41.65 milliseconds (1.6%)
  total debugger pause time: 1.0 seconds (44.1%)
  total dtrace DOF registration time:   0.00 milliseconds (0.0%)
  total rebase fixups:  295,165
  total rebase fixups time:  69.41 milliseconds (2.8%)
  total binding fixups: 29,525
  total binding fixups time:  46.85 milliseconds (1.9%)

  total weak binding fixups time:  10.28 milliseconds (0.4%)
  total redo shared cached bindings time:  30.76 milliseconds (1.2%)
  total bindings lazily fixed up: 0 of 0
  total time in initializers and ObjC +load: 202.46 milliseconds (8.2%)
                         libSystem.B.dylib :   7.37 milliseconds (0.2%)
               libBacktraceRecording.dylib :   5.82 milliseconds (0.2%)
                       libMTLCapture.dylib :  36.40 milliseconds (1.4%)
                                 Alamofire :   2.95 milliseconds (0.1%)
                                    Charts :   3.29 milliseconds (0.1%)
                              FBSDKCoreKit :   6.85 milliseconds (0.2%)
                                   Flutter :  79.66 milliseconds (3.2%)
                                 xxNetwork :   2.85 milliseconds (0.1%)
                                 HandyJSON :   2.61 milliseconds (0.1%)
                                MoyaMapper :   2.59 milliseconds (0.1%)
                                   RxSwift :   4.43 milliseconds (0.1%)
                                   RxCocoa :   7.06 milliseconds (0.2%)
                                        xx :  18.68 milliseconds (0.7%)
total symbol trie searches:    86758
total symbol table binary searches:    0
total images defining weak symbols:  70
total images using weak symbols:  157
The debugger has to pause launch on every single dylib load in order to parse the symbols from your app and load your break points, over a USB cable that can be very time consuming. But dyld knows about that and it subtracts the debugger time.
Launch Types
A warm launch is an app where the application is already in memory, either because it's been launched and quit previously, and it's still sitting in the discache in the kernel, or because you just copied it over.
A cold launch is a launch where it's not in the discache, when your user is launching an app after rebooting the phone, or for the first time in a long time.
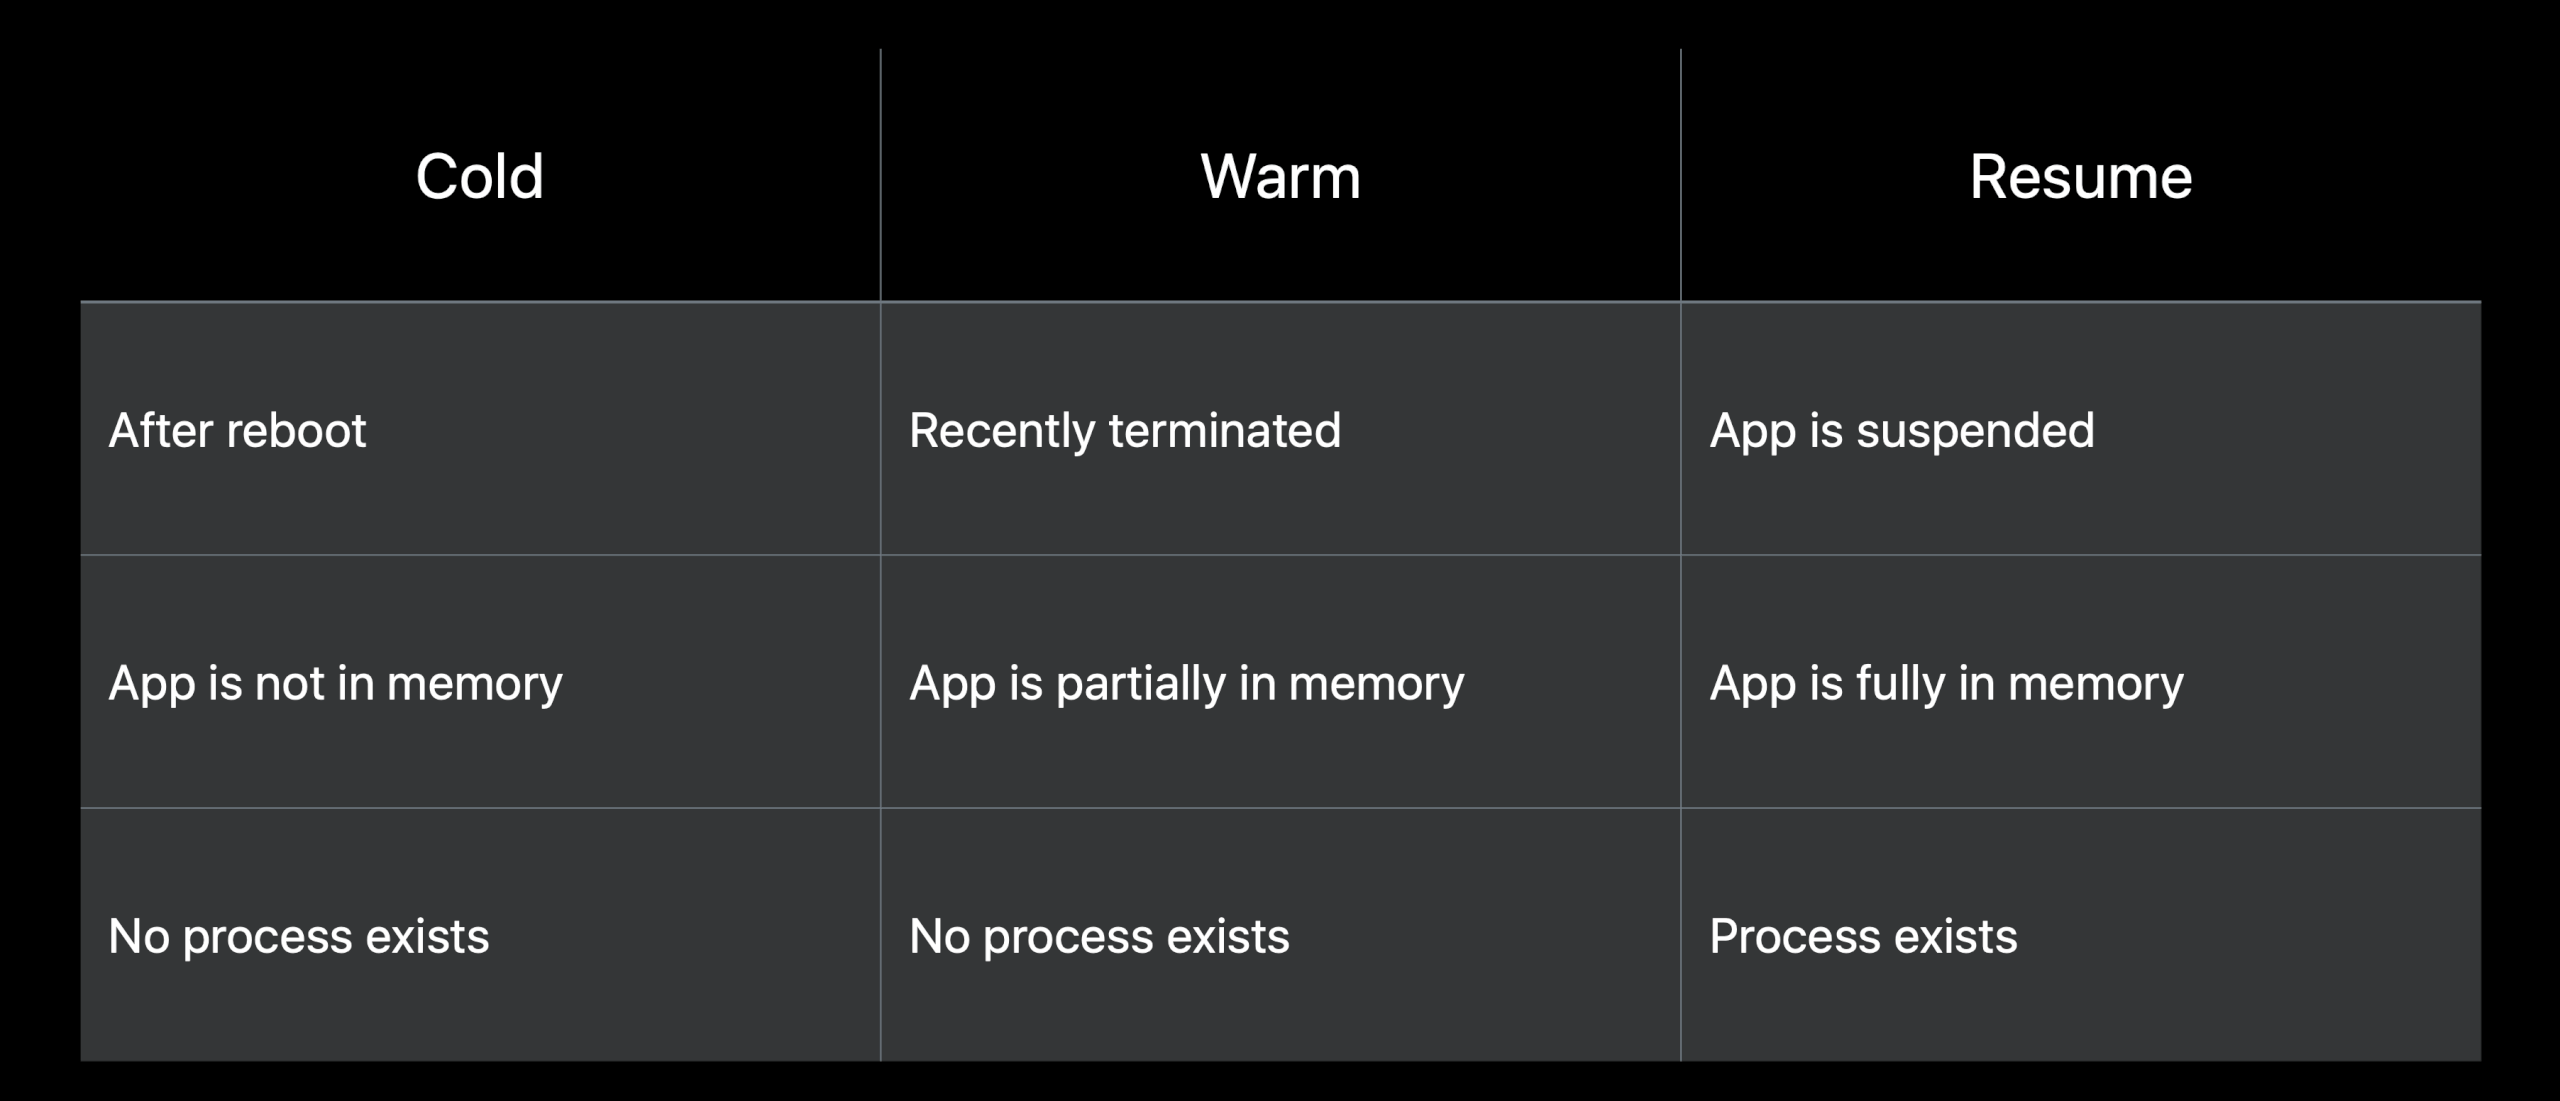
If you kill an app, it might not trigger a cold launch, because the system decides when the resources should be paged out. If you relaunch it a few second later, it's almost guaranteed that you'll hit a warm launch. We call it warm, because the resources or the dependents are still in the cache, so it's faster to launch.
- Cold launch: In order to launch your app, we need to bring it from disk into memory, startup system-side services that support your app, and then spawn your process.
- Warm launch: Your app still needs to be spawned, but we've already brought your app into memory and started up some of those system-side services. So, this will be a little bit faster and more consistent.
- Resume (Hot): occurs when a user reenters your app from either the home screen or the app switcher.
Best Practices
400 milliseconds is a good launch time. Don’t ever take longer than 20 seconds, in that case app will get killed.
After call main, we have to call UIApplicationMain, that does some other things including running the framework initializers and loading your nibs. And then finally you'll get a call back applicationWillFinishLaunching, which is also counted in that 400 milliseconds.
Use fewer dylibs, a good target is about 6:
- you can merge existing dylibs
- use static libraries
I/O is for both of rebasing and binding. So fixing up fewer pointers can help:
- Reduce Objective-C metadata (classes, selectors, and categories). There are a number of coding styles that are encouraging very small classes, that maybe only have one or two functions. Those particular patterns may result in gradual slowdowns of your applications. Having 100 or 1,000 classes isn't a problem, but 10,000 or 20,000 classes is.
- Reduce C++ virtual functions which create V-tables, that are the same as ObjC metadata. They create structures in the
__DATAsection that have to be fixed up. - Use Swift structs. Swift tends to use less data that has pointers for fixing up. Swift is more inlinable and can better co-gen to avoid a lot of that, so migrating to Swift is a great way to improve this.
- Be careful about machine generated codes. You may describe some structures in terms of a DSL (domain-specific language) and then have a program that generates other code from it. And if those generated programs have a lot of pointers in them, they can become very expensive.
For ObjC setup, we solved by less fix-ups before.
Initilizers:
- Replacing
+loadwith+initialize, which will cause the ObjC runtime to initialize your code when the classes were substantiated instead of when the file is loaded. - Don't use C/C++
__attribute__((constructor)). Replace with call site initializers, means things likedispatch_once(). - C++ statics with non-trivial constructors:
- replace those with call site initilizers
- Only set simple values (PODs, plain old data)
- Use
-Wglobal-constructorscompiler flag to identify those initilizers - Rewrite in Swift
- Do not call
dlopenin initializers - Do not create threads in initializers
New in iOS 11, we've added Static Initializer Tracing to Instruments. This is pretty exciting stuff because initializers are code that have to run before main to setup objects for you, and you haven't had much visibility into what happens before main. See WWDC 2017 - App Startup Time: Past, Present, and Future.
dyld3
dyld 3 has 3 components:
- An out-of-process Mach-O parser/compiler
- An in-process engine that runs launch closures
- A launch closure caching service
Instruments: App Launch Template
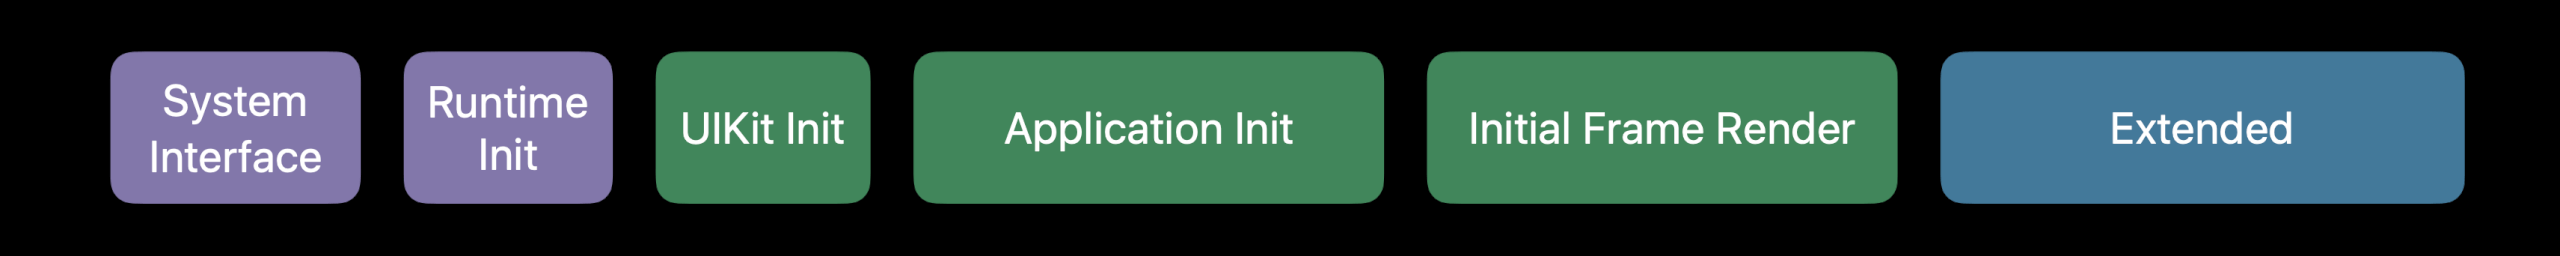
These six phases came from the new App Launch template in Instruments since Xcode 11. They cover everything from system initialization to the app initialization to view creation and layout, and then depending on your app, potentially a asynchronous loading phase for your data, the extended phase.
The first half of system interface is dyld. A dynamic linker (dyld) loads your shared libraries and frameworks. DYLD3 introduces caching of runtime dependencies to improve warm launch.
- Avoid linking unused frameworks
- Avoid dynamic library loading during launch, e.g.
dlopen,-[NSBundle load] - Hard link all your dependencies
The second half of system interface is libSystem Init. This is when we initialize the low-level system components within your application. This is mostly system-side work with a fixed cost. Developers don't need to focus on the section.
Runtime initialization: This is when the system initializes your Objective-C and Swift runtimes and invokes all class static load methods.
- Don't use static initialization. If you own a framework which uses static initialization, consider exposing API to initialize your stack early.
- Reduce impact to launch by avoiding
+[Class load]. - Use
+[Class initialize]to lazily conduct static initialization.
UIKit Initialization: This is when the system instantiates your UIApplication and UIApplicationDelegate.
- Minimize work in
UIApplicationsubclass - Minimize work in
UIApplicationDelegateinitialization
Application Initialization: This is where you get callbacks of the delegate methods.
- You should be deferring any unrelated work not necessary to commit your first frame, by either pushing it to the background queues or just doing it later entirely.
- If you did adopt
UIScene, make sure that you're sharing resources between scenes.
First Frame Render: Creates, performs layout for, and draws views. loadView, viewDidLoad, layoutSubviews.
- Flatten view hierarchies and lazily load views
- Optimize auto layout usage, reduce the number of constraints you're using
Extended phase: This is the app-specific period from the first frame to the final frame. To displays asynchronously loaded data.
- Leverage
os_signpostto measure work
In summary: Minimize, Prioritize, Optimize.
XCTest Metrics
Utilize the new XCTest app launch measurements on a variety of devices and possibly integrate this with continuous integration.
func testApplicationLaunchTime() {
    measure(metrics: [.applicationLaunch]) {
        XCUIApplication(bundleIdentifier: "com.yianzhou.demo").launch()
    }
}
实战
main 函数执行后:指的是从 main 函数执行开始,到 application(_:didFinishLaunchingWithOptions:) 方法里首屏渲染相关方法执行完成。主要包括了:首屏初始化所需配置文件的读写操作、首屏数据模型的读取、首屏渲染的计算等。优化方式是,排查业务代码,与首屏渲染无关的代码全部延后执行,例如类的初始化、监听注册等;首屏视图根据功能逻辑,暂时不需显示的采用懒加载;涉及文件或路径的操作,如检查文件夹是否存在,新建、复制、移动、删除文件等等操作,不要放在主线程。
首屏渲染完成后:从函数上来看,这个阶段指的是 application(_:didFinishLaunchingWithOptions:) 方法作用域内,执行首屏渲染之后的所有方法执行完成。这个阶段用户已经能够看到 App 的首页了,所以优化的优先级排在最后。但是,那些会卡住主线程的方法还是需要最优先处理的,不然还是会影响到用户的交互。
二进制重排
传统的启动优化是基于减少不必要代码、懒加载、利用多线程、延后执行与首屏渲染无关的代码来做的,主要是从减少主线程任务的角度来出发,此类相关优化的策略已经很普遍了,很难再做出大的提升。今天,我们从另一个角度去思考启动优化——内存加载机制。
APP 启动时,dyld 会把程序的二进制 mmap 到虚拟内存里,当执行代码需要使用到具体的物理内存时,再通过 page fault 触发物理内存加载,然后才能访问。
page fault 在较差的情况下耗时超过 1ms,在较正常的情况下也要耗时 0.3-0.6ms 左右。那么 App 启动期间大概需要发生多少次 page fault 呢?在我们应用中的数据如下:一次冷启动触发了 2000 多次 page fault,总耗时达到了 300+ms。(Instruments - System Trace - Virtual Memory Trace - File Backed Page In)
如果我们能让启动期间需要执行的指令,都紧凑地排列在相邻的内存分页,那么就能尽可能地减少 page fault 的次数,这就是二进制重排的目的。
Xcode 对二进制重排提供了支持,只需要在编译设置里指定一个 Order File 即可 (Build Settings - Linking - Order File),例如 objc 的源码就使用了这项技术(源码文件夹下的 libobjc.order 文件)。编译器会按照这个文件指定的符号顺序来排列二进制代码段,达到优化的目的。